German Russian vs Immigrants from Nigeria Single Father Households
COMPARE
German Russian
Immigrants from Nigeria
Single Father Households
Single Father Households Comparison
German Russians
Immigrants from Nigeria
2.4%
SINGLE FATHER HOUSEHOLDS
25.7/ 100
METRIC RATING
202nd/ 347
METRIC RANK
2.4%
SINGLE FATHER HOUSEHOLDS
18.7/ 100
METRIC RATING
211th/ 347
METRIC RANK
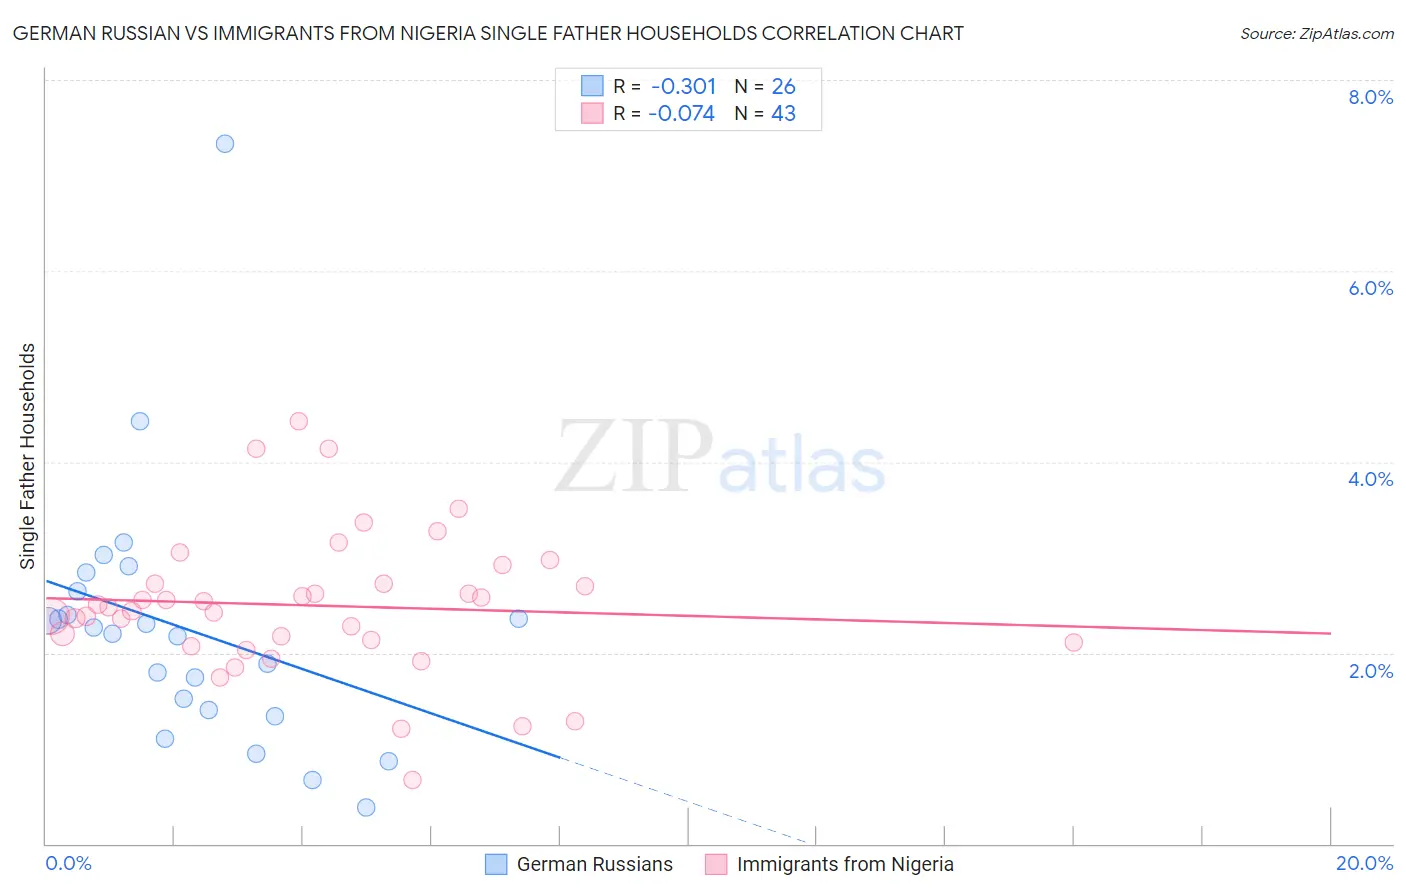
German Russian vs Immigrants from Nigeria Single Father Households Correlation Chart
The statistical analysis conducted on geographies consisting of 96,318,608 people shows a mild negative correlation between the proportion of German Russians and percentage of single father households in the United States with a correlation coefficient (R) of -0.301 and weighted average of 2.4%. Similarly, the statistical analysis conducted on geographies consisting of 282,146,516 people shows a slight negative correlation between the proportion of Immigrants from Nigeria and percentage of single father households in the United States with a correlation coefficient (R) of -0.074 and weighted average of 2.4%, a difference of 0.73%.
Single Father Households Correlation Summary
| Measurement | German Russian | Immigrants from Nigeria |
| Minimum | 0.38% | 0.66% |
| Maximum | 7.3% | 4.4% |
| Range | 7.0% | 3.8% |
| Mean | 2.2% | 2.5% |
| Median | 2.2% | 2.5% |
| Interquartile 25% (IQ1) | 1.4% | 2.1% |
| Interquartile 75% (IQ3) | 2.7% | 2.7% |
| Interquartile Range (IQR) | 1.3% | 0.62% |
| Standard Deviation (Sample) | 1.4% | 0.75% |
| Standard Deviation (Population) | 1.3% | 0.74% |
Demographics Similar to German Russians and Immigrants from Nigeria by Single Father Households
In terms of single father households, the demographic groups most similar to German Russians are Immigrants from Uganda (2.4%, a difference of 0.030%), French Canadian (2.4%, a difference of 0.10%), Ecuadorian (2.4%, a difference of 0.12%), Immigrants from Vietnam (2.4%, a difference of 0.13%), and Peruvian (2.4%, a difference of 0.13%). Similarly, the demographic groups most similar to Immigrants from Nigeria are Immigrants from Costa Rica (2.4%, a difference of 0.050%), Finnish (2.4%, a difference of 0.050%), Immigrants from Peru (2.4%, a difference of 0.060%), Immigrants from Kenya (2.4%, a difference of 0.18%), and Norwegian (2.4%, a difference of 0.20%).
| Demographics | Rating | Rank | Single Father Households |
| Kenyans | 28.0 /100 | #196 | Fair 2.4% |
| Germans | 28.0 /100 | #197 | Fair 2.4% |
| Scandinavians | 27.4 /100 | #198 | Fair 2.4% |
| Immigrants | Vietnam | 27.1 /100 | #199 | Fair 2.4% |
| Peruvians | 27.1 /100 | #200 | Fair 2.4% |
| Immigrants | Uganda | 26.0 /100 | #201 | Fair 2.4% |
| German Russians | 25.7 /100 | #202 | Fair 2.4% |
| French Canadians | 24.7 /100 | #203 | Fair 2.4% |
| Ecuadorians | 24.5 /100 | #204 | Fair 2.4% |
| Immigrants | Afghanistan | 24.2 /100 | #205 | Fair 2.4% |
| Koreans | 24.1 /100 | #206 | Fair 2.4% |
| Whites/Caucasians | 22.6 /100 | #207 | Fair 2.4% |
| Immigrants | Kenya | 20.3 /100 | #208 | Fair 2.4% |
| Immigrants | Peru | 19.3 /100 | #209 | Poor 2.4% |
| Immigrants | Costa Rica | 19.2 /100 | #210 | Poor 2.4% |
| Immigrants | Nigeria | 18.7 /100 | #211 | Poor 2.4% |
| Finns | 18.3 /100 | #212 | Poor 2.4% |
| Norwegians | 17.1 /100 | #213 | Poor 2.4% |
| Ethiopians | 16.6 /100 | #214 | Poor 2.4% |
| Immigrants | South Eastern Asia | 15.9 /100 | #215 | Poor 2.4% |
| Immigrants | Ecuador | 14.9 /100 | #216 | Poor 2.4% |