English vs Immigrants from Eastern Africa In Labor Force | Age 25-29
COMPARE
English
Immigrants from Eastern Africa
In Labor Force | Age 25-29
In Labor Force | Age 25-29 Comparison
English
Immigrants from Eastern Africa
84.5%
IN LABOR FORCE | AGE 25-29
25.8/ 100
METRIC RATING
192nd/ 347
METRIC RANK
86.0%
IN LABOR FORCE | AGE 25-29
100.0/ 100
METRIC RATING
24th/ 347
METRIC RANK
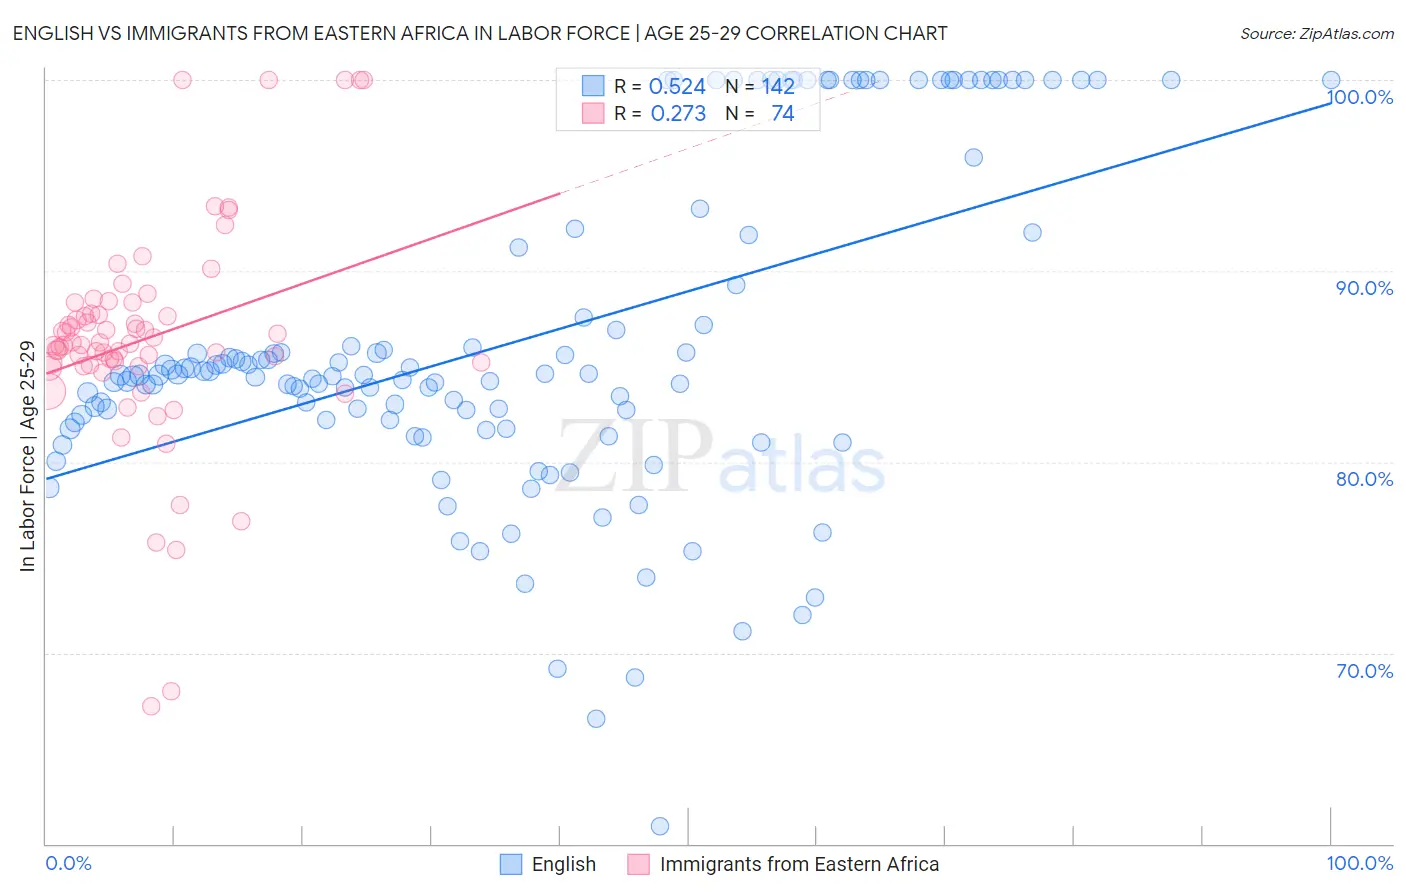
English vs Immigrants from Eastern Africa In Labor Force | Age 25-29 Correlation Chart
The statistical analysis conducted on geographies consisting of 577,776,495 people shows a substantial positive correlation between the proportion of English and labor force participation rate among population between the ages 25 and 29 in the United States with a correlation coefficient (R) of 0.524 and weighted average of 84.5%. Similarly, the statistical analysis conducted on geographies consisting of 355,077,825 people shows a weak positive correlation between the proportion of Immigrants from Eastern Africa and labor force participation rate among population between the ages 25 and 29 in the United States with a correlation coefficient (R) of 0.273 and weighted average of 86.0%, a difference of 1.7%.
In Labor Force | Age 25-29 Correlation Summary
| Measurement | English | Immigrants from Eastern Africa |
| Minimum | 60.9% | 67.2% |
| Maximum | 100.0% | 100.0% |
| Range | 39.1% | 32.8% |
| Mean | 86.4% | 86.5% |
| Median | 84.5% | 86.1% |
| Interquartile 25% (IQ1) | 82.2% | 85.1% |
| Interquartile 75% (IQ3) | 91.9% | 87.8% |
| Interquartile Range (IQR) | 9.7% | 2.7% |
| Standard Deviation (Sample) | 8.6% | 5.8% |
| Standard Deviation (Population) | 8.6% | 5.7% |
Similar Demographics by In Labor Force | Age 25-29
Demographics Similar to English by In Labor Force | Age 25-29
In terms of in labor force | age 25-29, the demographic groups most similar to English are South American Indian (84.5%, a difference of 0.010%), Zimbabwean (84.5%, a difference of 0.030%), Welsh (84.5%, a difference of 0.050%), Portuguese (84.4%, a difference of 0.050%), and Immigrants from Israel (84.4%, a difference of 0.050%).
| Demographics | Rating | Rank | In Labor Force | Age 25-29 |
| Immigrants | Denmark | 37.0 /100 | #185 | Fair 84.6% |
| Immigrants | Belgium | 35.0 /100 | #186 | Fair 84.6% |
| Immigrants | Portugal | 34.7 /100 | #187 | Fair 84.6% |
| Immigrants | Ukraine | 33.7 /100 | #188 | Fair 84.5% |
| Moroccans | 32.6 /100 | #189 | Fair 84.5% |
| Welsh | 31.1 /100 | #190 | Fair 84.5% |
| Zimbabweans | 28.7 /100 | #191 | Fair 84.5% |
| English | 25.8 /100 | #192 | Fair 84.5% |
| South American Indians | 25.0 /100 | #193 | Fair 84.5% |
| Portuguese | 21.2 /100 | #194 | Fair 84.4% |
| Immigrants | Israel | 20.8 /100 | #195 | Fair 84.4% |
| Immigrants | South Eastern Asia | 19.5 /100 | #196 | Poor 84.4% |
| Tlingit-Haida | 19.3 /100 | #197 | Poor 84.4% |
| Immigrants | Iraq | 19.0 /100 | #198 | Poor 84.4% |
| Immigrants | Germany | 18.3 /100 | #199 | Poor 84.4% |
Demographics Similar to Immigrants from Eastern Africa by In Labor Force | Age 25-29
In terms of in labor force | age 25-29, the demographic groups most similar to Immigrants from Eastern Africa are Immigrants from Uganda (86.0%, a difference of 0.010%), Sudanese (85.9%, a difference of 0.010%), Cambodian (86.0%, a difference of 0.030%), Maltese (86.0%, a difference of 0.040%), and Immigrants from Ireland (86.0%, a difference of 0.050%).
| Demographics | Rating | Rank | In Labor Force | Age 25-29 |
| Bermudans | 100.0 /100 | #17 | Exceptional 86.0% |
| Bulgarians | 100.0 /100 | #18 | Exceptional 86.0% |
| Cape Verdeans | 100.0 /100 | #19 | Exceptional 86.0% |
| Immigrants | Ireland | 100.0 /100 | #20 | Exceptional 86.0% |
| Maltese | 100.0 /100 | #21 | Exceptional 86.0% |
| Cambodians | 100.0 /100 | #22 | Exceptional 86.0% |
| Immigrants | Uganda | 100.0 /100 | #23 | Exceptional 86.0% |
| Immigrants | Eastern Africa | 100.0 /100 | #24 | Exceptional 86.0% |
| Sudanese | 100.0 /100 | #25 | Exceptional 85.9% |
| Immigrants | North Macedonia | 100.0 /100 | #26 | Exceptional 85.9% |
| Paraguayans | 100.0 /100 | #27 | Exceptional 85.9% |
| Ugandans | 100.0 /100 | #28 | Exceptional 85.9% |
| Immigrants | Liberia | 100.0 /100 | #29 | Exceptional 85.9% |
| Immigrants | Serbia | 100.0 /100 | #30 | Exceptional 85.9% |
| German Russians | 100.0 /100 | #31 | Exceptional 85.8% |