Ecuadorian vs Honduran In Labor Force | Age 45-54
COMPARE
Ecuadorian
Honduran
In Labor Force | Age 45-54
In Labor Force | Age 45-54 Comparison
Ecuadorians
Hondurans
82.3%
IN LABOR FORCE | AGE 45-54
6.3/ 100
METRIC RATING
212th/ 347
METRIC RANK
81.4%
IN LABOR FORCE | AGE 45-54
0.1/ 100
METRIC RATING
265th/ 347
METRIC RANK
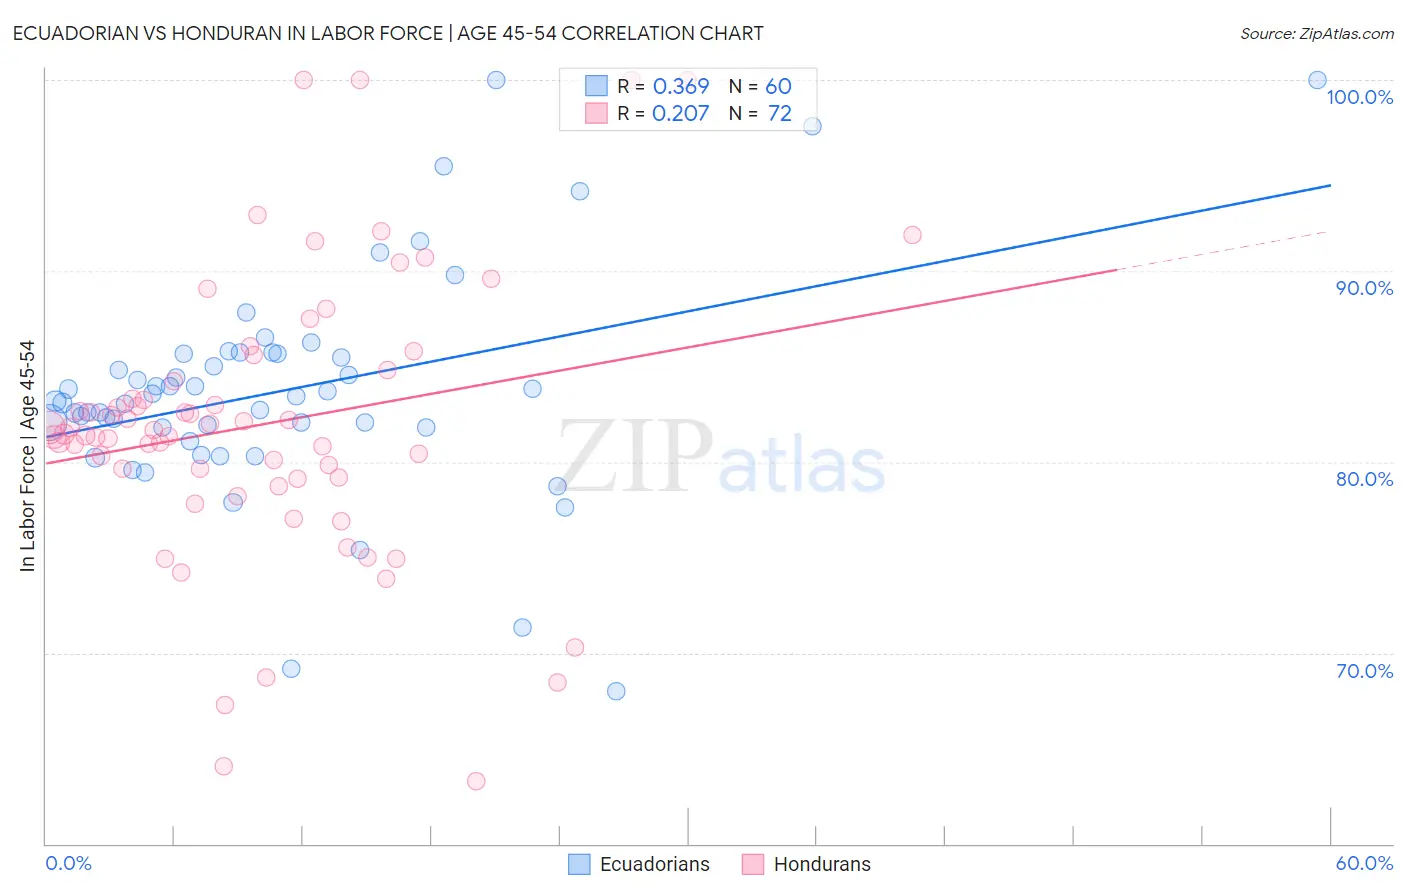
Ecuadorian vs Honduran In Labor Force | Age 45-54 Correlation Chart
The statistical analysis conducted on geographies consisting of 317,622,832 people shows a mild positive correlation between the proportion of Ecuadorians and labor force participation rate among population between the ages 45 and 54 in the United States with a correlation coefficient (R) of 0.369 and weighted average of 82.3%. Similarly, the statistical analysis conducted on geographies consisting of 357,603,767 people shows a weak positive correlation between the proportion of Hondurans and labor force participation rate among population between the ages 45 and 54 in the United States with a correlation coefficient (R) of 0.207 and weighted average of 81.4%, a difference of 1.0%.
In Labor Force | Age 45-54 Correlation Summary
| Measurement | Ecuadorian | Honduran |
| Minimum | 68.0% | 63.3% |
| Maximum | 100.0% | 100.0% |
| Range | 32.0% | 36.7% |
| Mean | 83.8% | 82.0% |
| Median | 83.3% | 81.6% |
| Interquartile 25% (IQ1) | 81.8% | 79.1% |
| Interquartile 75% (IQ3) | 85.7% | 84.5% |
| Interquartile Range (IQR) | 3.9% | 5.4% |
| Standard Deviation (Sample) | 5.9% | 7.4% |
| Standard Deviation (Population) | 5.9% | 7.4% |
Similar Demographics by In Labor Force | Age 45-54
Demographics Similar to Ecuadorians by In Labor Force | Age 45-54
In terms of in labor force | age 45-54, the demographic groups most similar to Ecuadorians are Immigrants from Syria (82.3%, a difference of 0.010%), Immigrants from Uzbekistan (82.3%, a difference of 0.020%), Immigrants from Bahamas (82.3%, a difference of 0.030%), Immigrants from Panama (82.2%, a difference of 0.030%), and Iraqi (82.2%, a difference of 0.030%).
| Demographics | Rating | Rank | In Labor Force | Age 45-54 |
| Senegalese | 9.5 /100 | #205 | Tragic 82.4% |
| Welsh | 9.2 /100 | #206 | Tragic 82.3% |
| Immigrants | Cabo Verde | 8.6 /100 | #207 | Tragic 82.3% |
| Native Hawaiians | 8.5 /100 | #208 | Tragic 82.3% |
| Immigrants | Lebanon | 7.4 /100 | #209 | Tragic 82.3% |
| Immigrants | Bahamas | 7.1 /100 | #210 | Tragic 82.3% |
| Immigrants | Syria | 6.6 /100 | #211 | Tragic 82.3% |
| Ecuadorians | 6.3 /100 | #212 | Tragic 82.3% |
| Immigrants | Uzbekistan | 5.8 /100 | #213 | Tragic 82.3% |
| Immigrants | Panama | 5.6 /100 | #214 | Tragic 82.2% |
| Iraqis | 5.6 /100 | #215 | Tragic 82.2% |
| Scottish | 5.3 /100 | #216 | Tragic 82.2% |
| Portuguese | 4.7 /100 | #217 | Tragic 82.2% |
| English | 4.4 /100 | #218 | Tragic 82.2% |
| French | 4.1 /100 | #219 | Tragic 82.2% |
Demographics Similar to Hondurans by In Labor Force | Age 45-54
In terms of in labor force | age 45-54, the demographic groups most similar to Hondurans are Indonesian (81.5%, a difference of 0.050%), Immigrants from West Indies (81.5%, a difference of 0.050%), Immigrants from Guyana (81.5%, a difference of 0.060%), Hawaiian (81.5%, a difference of 0.070%), and Spaniard (81.5%, a difference of 0.080%).
| Demographics | Rating | Rank | In Labor Force | Age 45-54 |
| Immigrants | Fiji | 0.1 /100 | #258 | Tragic 81.5% |
| Guyanese | 0.1 /100 | #259 | Tragic 81.5% |
| Spaniards | 0.1 /100 | #260 | Tragic 81.5% |
| Hawaiians | 0.1 /100 | #261 | Tragic 81.5% |
| Immigrants | Guyana | 0.1 /100 | #262 | Tragic 81.5% |
| Indonesians | 0.1 /100 | #263 | Tragic 81.5% |
| Immigrants | West Indies | 0.1 /100 | #264 | Tragic 81.5% |
| Hondurans | 0.1 /100 | #265 | Tragic 81.4% |
| Immigrants | St. Vincent and the Grenadines | 0.1 /100 | #266 | Tragic 81.4% |
| West Indians | 0.1 /100 | #267 | Tragic 81.4% |
| Immigrants | Honduras | 0.0 /100 | #268 | Tragic 81.4% |
| Alsatians | 0.0 /100 | #269 | Tragic 81.3% |
| Bangladeshis | 0.0 /100 | #270 | Tragic 81.3% |
| Immigrants | Barbados | 0.0 /100 | #271 | Tragic 81.3% |
| Spanish | 0.0 /100 | #272 | Tragic 81.3% |