Subsaharan African vs Honduran In Labor Force | Age 45-54
COMPARE
Subsaharan African
Honduran
In Labor Force | Age 45-54
In Labor Force | Age 45-54 Comparison
Sub-Saharan Africans
Hondurans
82.0%
IN LABOR FORCE | AGE 45-54
1.2/ 100
METRIC RATING
235th/ 347
METRIC RANK
81.4%
IN LABOR FORCE | AGE 45-54
0.1/ 100
METRIC RATING
265th/ 347
METRIC RANK
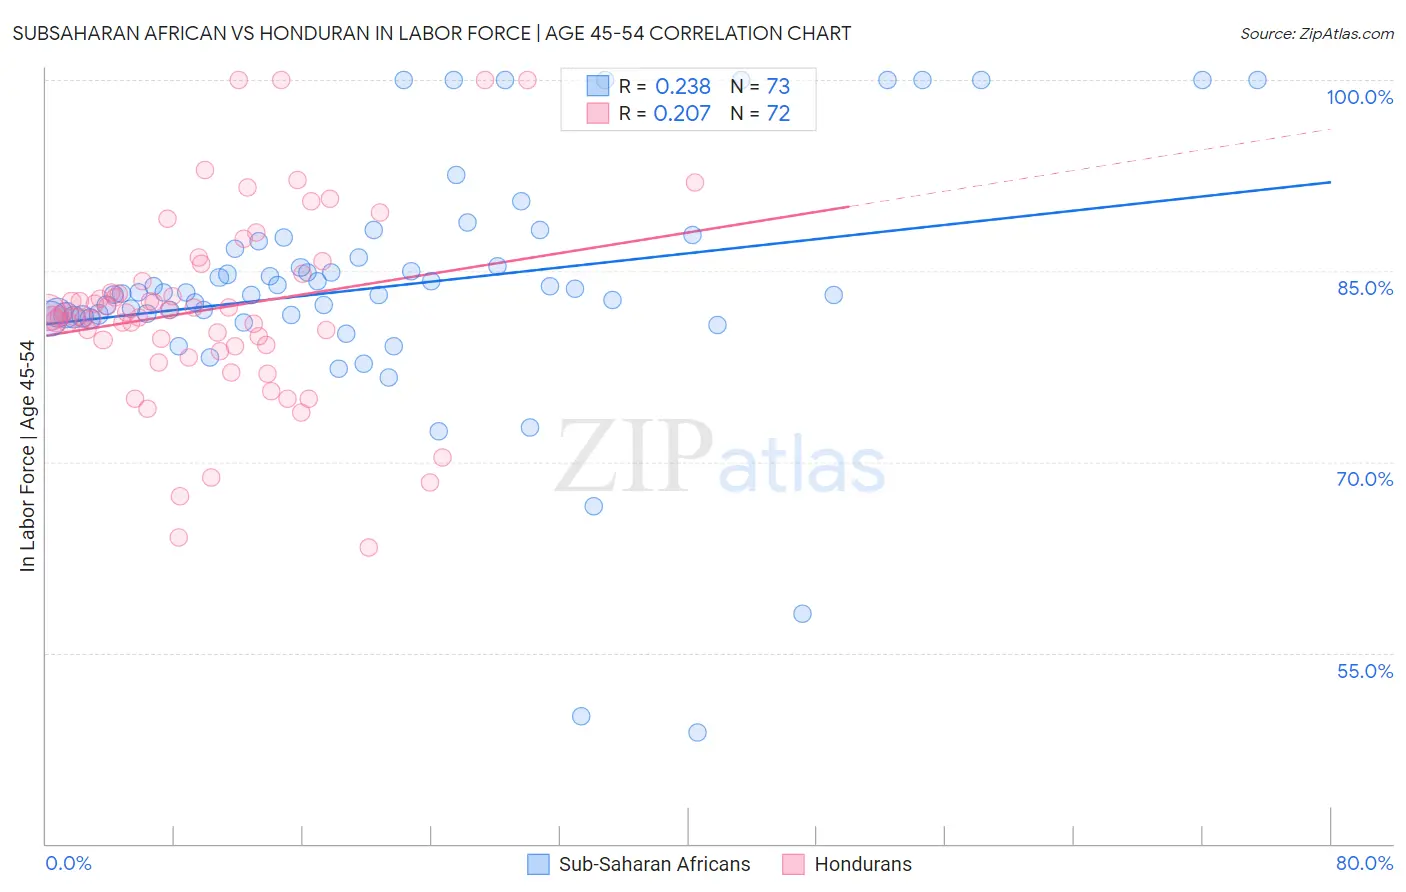
Subsaharan African vs Honduran In Labor Force | Age 45-54 Correlation Chart
The statistical analysis conducted on geographies consisting of 507,566,775 people shows a weak positive correlation between the proportion of Sub-Saharan Africans and labor force participation rate among population between the ages 45 and 54 in the United States with a correlation coefficient (R) of 0.238 and weighted average of 82.0%. Similarly, the statistical analysis conducted on geographies consisting of 357,603,767 people shows a weak positive correlation between the proportion of Hondurans and labor force participation rate among population between the ages 45 and 54 in the United States with a correlation coefficient (R) of 0.207 and weighted average of 81.4%, a difference of 0.63%.
In Labor Force | Age 45-54 Correlation Summary
| Measurement | Subsaharan African | Honduran |
| Minimum | 48.7% | 63.3% |
| Maximum | 100.0% | 100.0% |
| Range | 51.3% | 36.7% |
| Mean | 83.8% | 82.0% |
| Median | 83.3% | 81.6% |
| Interquartile 25% (IQ1) | 81.4% | 79.1% |
| Interquartile 75% (IQ3) | 87.0% | 84.5% |
| Interquartile Range (IQR) | 5.6% | 5.4% |
| Standard Deviation (Sample) | 9.7% | 7.4% |
| Standard Deviation (Population) | 9.6% | 7.4% |
Similar Demographics by In Labor Force | Age 45-54
Demographics Similar to Sub-Saharan Africans by In Labor Force | Age 45-54
In terms of in labor force | age 45-54, the demographic groups most similar to Sub-Saharan Africans are Basque (82.0%, a difference of 0.010%), Immigrants from Trinidad and Tobago (82.0%, a difference of 0.010%), Trinidadian and Tobagonian (81.9%, a difference of 0.020%), Immigrants from Thailand (81.9%, a difference of 0.040%), and Immigrants from El Salvador (81.9%, a difference of 0.050%).
| Demographics | Rating | Rank | In Labor Force | Age 45-54 |
| Cape Verdeans | 2.1 /100 | #228 | Tragic 82.1% |
| Immigrants | Burma/Myanmar | 1.9 /100 | #229 | Tragic 82.0% |
| Jamaicans | 1.8 /100 | #230 | Tragic 82.0% |
| Immigrants | Senegal | 1.7 /100 | #231 | Tragic 82.0% |
| Immigrants | Portugal | 1.7 /100 | #232 | Tragic 82.0% |
| Malaysians | 1.7 /100 | #233 | Tragic 82.0% |
| Salvadorans | 1.7 /100 | #234 | Tragic 82.0% |
| Sub-Saharan Africans | 1.2 /100 | #235 | Tragic 82.0% |
| Basques | 1.2 /100 | #236 | Tragic 82.0% |
| Immigrants | Trinidad and Tobago | 1.2 /100 | #237 | Tragic 82.0% |
| Trinidadians and Tobagonians | 1.1 /100 | #238 | Tragic 81.9% |
| Immigrants | Thailand | 1.0 /100 | #239 | Tragic 81.9% |
| Immigrants | El Salvador | 1.0 /100 | #240 | Tragic 81.9% |
| Immigrants | Cambodia | 0.8 /100 | #241 | Tragic 81.9% |
| Whites/Caucasians | 0.7 /100 | #242 | Tragic 81.9% |
Demographics Similar to Hondurans by In Labor Force | Age 45-54
In terms of in labor force | age 45-54, the demographic groups most similar to Hondurans are Indonesian (81.5%, a difference of 0.050%), Immigrants from West Indies (81.5%, a difference of 0.050%), Immigrants from Guyana (81.5%, a difference of 0.060%), Hawaiian (81.5%, a difference of 0.070%), and Spaniard (81.5%, a difference of 0.080%).
| Demographics | Rating | Rank | In Labor Force | Age 45-54 |
| Immigrants | Fiji | 0.1 /100 | #258 | Tragic 81.5% |
| Guyanese | 0.1 /100 | #259 | Tragic 81.5% |
| Spaniards | 0.1 /100 | #260 | Tragic 81.5% |
| Hawaiians | 0.1 /100 | #261 | Tragic 81.5% |
| Immigrants | Guyana | 0.1 /100 | #262 | Tragic 81.5% |
| Indonesians | 0.1 /100 | #263 | Tragic 81.5% |
| Immigrants | West Indies | 0.1 /100 | #264 | Tragic 81.5% |
| Hondurans | 0.1 /100 | #265 | Tragic 81.4% |
| Immigrants | St. Vincent and the Grenadines | 0.1 /100 | #266 | Tragic 81.4% |
| West Indians | 0.1 /100 | #267 | Tragic 81.4% |
| Immigrants | Honduras | 0.0 /100 | #268 | Tragic 81.4% |
| Alsatians | 0.0 /100 | #269 | Tragic 81.3% |
| Bangladeshis | 0.0 /100 | #270 | Tragic 81.3% |
| Immigrants | Barbados | 0.0 /100 | #271 | Tragic 81.3% |
| Spanish | 0.0 /100 | #272 | Tragic 81.3% |