Crow vs Immigrants from Iran In Labor Force | Age 45-54
COMPARE
Crow
Immigrants from Iran
In Labor Force | Age 45-54
In Labor Force | Age 45-54 Comparison
Crow
Immigrants from Iran
78.3%
IN LABOR FORCE | AGE 45-54
0.0/ 100
METRIC RATING
322nd/ 347
METRIC RANK
83.1%
IN LABOR FORCE | AGE 45-54
87.2/ 100
METRIC RATING
125th/ 347
METRIC RANK
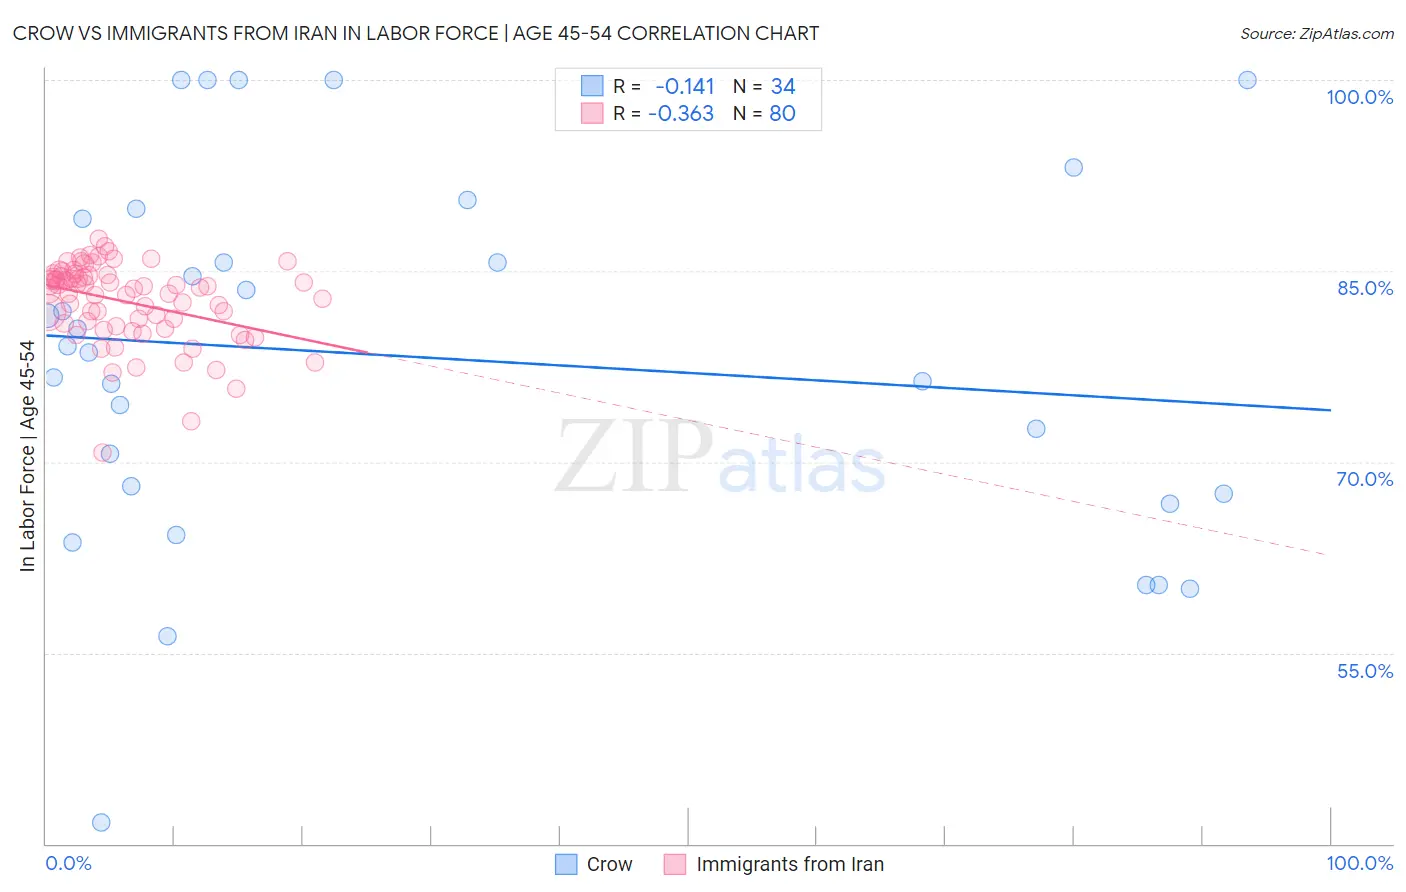
Crow vs Immigrants from Iran In Labor Force | Age 45-54 Correlation Chart
The statistical analysis conducted on geographies consisting of 59,202,110 people shows a poor negative correlation between the proportion of Crow and labor force participation rate among population between the ages 45 and 54 in the United States with a correlation coefficient (R) of -0.141 and weighted average of 78.3%. Similarly, the statistical analysis conducted on geographies consisting of 279,820,433 people shows a mild negative correlation between the proportion of Immigrants from Iran and labor force participation rate among population between the ages 45 and 54 in the United States with a correlation coefficient (R) of -0.363 and weighted average of 83.1%, a difference of 6.1%.
In Labor Force | Age 45-54 Correlation Summary
| Measurement | Crow | Immigrants from Iran |
| Minimum | 41.7% | 70.7% |
| Maximum | 100.0% | 87.6% |
| Range | 58.3% | 16.9% |
| Mean | 78.2% | 82.6% |
| Median | 78.8% | 83.7% |
| Interquartile 25% (IQ1) | 67.5% | 80.8% |
| Interquartile 75% (IQ3) | 89.1% | 84.6% |
| Interquartile Range (IQR) | 21.6% | 3.9% |
| Standard Deviation (Sample) | 14.4% | 3.1% |
| Standard Deviation (Population) | 14.2% | 3.1% |
Similar Demographics by In Labor Force | Age 45-54
Demographics Similar to Crow by In Labor Force | Age 45-54
In terms of in labor force | age 45-54, the demographic groups most similar to Crow are Kiowa (78.3%, a difference of 0.080%), Dutch West Indian (78.2%, a difference of 0.10%), Choctaw (78.2%, a difference of 0.20%), Seminole (78.1%, a difference of 0.24%), and Cajun (78.1%, a difference of 0.25%).
| Demographics | Rating | Rank | In Labor Force | Age 45-54 |
| Blacks/African Americans | 0.0 /100 | #315 | Tragic 79.3% |
| Shoshone | 0.0 /100 | #316 | Tragic 79.3% |
| Comanche | 0.0 /100 | #317 | Tragic 79.2% |
| Chickasaw | 0.0 /100 | #318 | Tragic 79.0% |
| Cherokee | 0.0 /100 | #319 | Tragic 79.0% |
| Yaqui | 0.0 /100 | #320 | Tragic 78.9% |
| Yup'ik | 0.0 /100 | #321 | Tragic 78.6% |
| Crow | 0.0 /100 | #322 | Tragic 78.3% |
| Kiowa | 0.0 /100 | #323 | Tragic 78.3% |
| Dutch West Indians | 0.0 /100 | #324 | Tragic 78.2% |
| Choctaw | 0.0 /100 | #325 | Tragic 78.2% |
| Seminole | 0.0 /100 | #326 | Tragic 78.1% |
| Cajuns | 0.0 /100 | #327 | Tragic 78.1% |
| Sioux | 0.0 /100 | #328 | Tragic 78.0% |
| Creek | 0.0 /100 | #329 | Tragic 77.7% |
Demographics Similar to Immigrants from Iran by In Labor Force | Age 45-54
In terms of in labor force | age 45-54, the demographic groups most similar to Immigrants from Iran are Tongan (83.1%, a difference of 0.020%), Bermudan (83.1%, a difference of 0.020%), Immigrants from Belgium (83.1%, a difference of 0.020%), Immigrants from Vietnam (83.1%, a difference of 0.030%), and Uruguayan (83.1%, a difference of 0.040%).
| Demographics | Rating | Rank | In Labor Force | Age 45-54 |
| Immigrants | Europe | 90.7 /100 | #118 | Exceptional 83.2% |
| Immigrants | Uruguay | 90.2 /100 | #119 | Exceptional 83.2% |
| Immigrants | Russia | 90.1 /100 | #120 | Exceptional 83.2% |
| Uruguayans | 89.4 /100 | #121 | Excellent 83.1% |
| Immigrants | Vietnam | 88.9 /100 | #122 | Excellent 83.1% |
| Tongans | 88.2 /100 | #123 | Excellent 83.1% |
| Bermudans | 88.0 /100 | #124 | Excellent 83.1% |
| Immigrants | Iran | 87.2 /100 | #125 | Excellent 83.1% |
| Immigrants | Belgium | 86.4 /100 | #126 | Excellent 83.1% |
| Immigrants | Jordan | 85.2 /100 | #127 | Excellent 83.1% |
| Germans | 85.1 /100 | #128 | Excellent 83.1% |
| Immigrants | Northern Europe | 85.1 /100 | #129 | Excellent 83.1% |
| Immigrants | Israel | 84.7 /100 | #130 | Excellent 83.1% |
| Finns | 83.3 /100 | #131 | Excellent 83.1% |
| Immigrants | Ukraine | 82.9 /100 | #132 | Excellent 83.0% |