Croatian vs Colombian In Labor Force | Age 16-19
COMPARE
Croatian
Colombian
In Labor Force | Age 16-19
In Labor Force | Age 16-19 Comparison
Croatians
Colombians
41.1%
IN LABOR FORCE | AGE 16-19
100.0/ 100
METRIC RATING
45th/ 347
METRIC RANK
33.8%
IN LABOR FORCE | AGE 16-19
0.3/ 100
METRIC RATING
278th/ 347
METRIC RANK
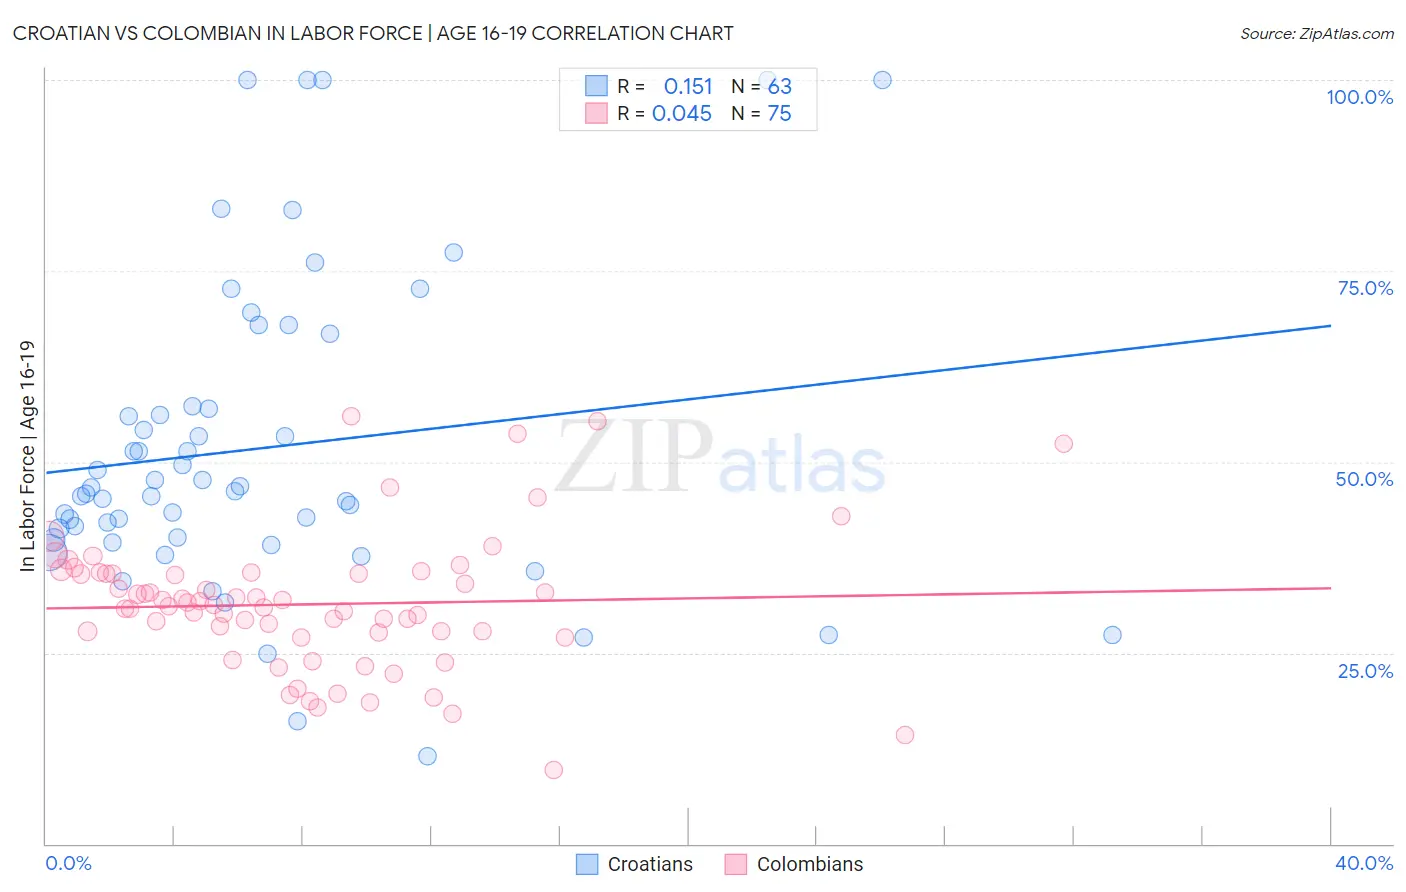
Croatian vs Colombian In Labor Force | Age 16-19 Correlation Chart
The statistical analysis conducted on geographies consisting of 375,104,825 people shows a poor positive correlation between the proportion of Croatians and labor force participation rate among population between the ages 16 and 19 in the United States with a correlation coefficient (R) of 0.151 and weighted average of 41.1%. Similarly, the statistical analysis conducted on geographies consisting of 418,996,836 people shows no correlation between the proportion of Colombians and labor force participation rate among population between the ages 16 and 19 in the United States with a correlation coefficient (R) of 0.045 and weighted average of 33.8%, a difference of 21.5%.
In Labor Force | Age 16-19 Correlation Summary
| Measurement | Croatian | Colombian |
| Minimum | 11.5% | 9.6% |
| Maximum | 100.0% | 56.0% |
| Range | 88.5% | 46.4% |
| Mean | 51.8% | 31.4% |
| Median | 46.2% | 31.3% |
| Interquartile 25% (IQ1) | 39.8% | 27.7% |
| Interquartile 75% (IQ3) | 57.3% | 35.4% |
| Interquartile Range (IQR) | 17.4% | 7.7% |
| Standard Deviation (Sample) | 20.4% | 8.8% |
| Standard Deviation (Population) | 20.3% | 8.7% |
Similar Demographics by In Labor Force | Age 16-19
Demographics Similar to Croatians by In Labor Force | Age 16-19
In terms of in labor force | age 16-19, the demographic groups most similar to Croatians are European (41.1%, a difference of 0.040%), Tongan (41.2%, a difference of 0.14%), Immigrants from Sudan (41.0%, a difference of 0.32%), Celtic (41.3%, a difference of 0.45%), and White/Caucasian (41.3%, a difference of 0.45%).
| Demographics | Rating | Rank | In Labor Force | Age 16-19 |
| Sioux | 100.0 /100 | #38 | Exceptional 41.5% |
| Scotch-Irish | 100.0 /100 | #39 | Exceptional 41.5% |
| Immigrants | Liberia | 100.0 /100 | #40 | Exceptional 41.5% |
| Celtics | 100.0 /100 | #41 | Exceptional 41.3% |
| Whites/Caucasians | 100.0 /100 | #42 | Exceptional 41.3% |
| Tongans | 100.0 /100 | #43 | Exceptional 41.2% |
| Europeans | 100.0 /100 | #44 | Exceptional 41.1% |
| Croatians | 100.0 /100 | #45 | Exceptional 41.1% |
| Immigrants | Sudan | 100.0 /100 | #46 | Exceptional 41.0% |
| Carpatho Rusyns | 100.0 /100 | #47 | Exceptional 40.8% |
| Icelanders | 100.0 /100 | #48 | Exceptional 40.8% |
| Cree | 100.0 /100 | #49 | Exceptional 40.8% |
| Indonesians | 100.0 /100 | #50 | Exceptional 40.7% |
| Immigrants | Zaire | 100.0 /100 | #51 | Exceptional 40.7% |
| Immigrants | Laos | 100.0 /100 | #52 | Exceptional 40.6% |
Demographics Similar to Colombians by In Labor Force | Age 16-19
In terms of in labor force | age 16-19, the demographic groups most similar to Colombians are Paraguayan (33.8%, a difference of 0.010%), Taiwanese (33.8%, a difference of 0.020%), Cypriot (33.8%, a difference of 0.020%), Immigrants from Korea (33.8%, a difference of 0.030%), and Menominee (33.9%, a difference of 0.070%).
| Demographics | Rating | Rank | In Labor Force | Age 16-19 |
| Central American Indians | 0.4 /100 | #271 | Tragic 34.1% |
| Asians | 0.4 /100 | #272 | Tragic 34.1% |
| Immigrants | Panama | 0.4 /100 | #273 | Tragic 34.0% |
| Venezuelans | 0.3 /100 | #274 | Tragic 34.0% |
| Immigrants | Fiji | 0.3 /100 | #275 | Tragic 33.9% |
| Immigrants | Latin America | 0.3 /100 | #276 | Tragic 33.9% |
| Menominee | 0.3 /100 | #277 | Tragic 33.9% |
| Colombians | 0.3 /100 | #278 | Tragic 33.8% |
| Paraguayans | 0.3 /100 | #279 | Tragic 33.8% |
| Taiwanese | 0.3 /100 | #280 | Tragic 33.8% |
| Cypriots | 0.3 /100 | #281 | Tragic 33.8% |
| Immigrants | Korea | 0.3 /100 | #282 | Tragic 33.8% |
| Immigrants | Venezuela | 0.2 /100 | #283 | Tragic 33.7% |
| Immigrants | Spain | 0.2 /100 | #284 | Tragic 33.7% |
| U.S. Virgin Islanders | 0.2 /100 | #285 | Tragic 33.6% |