Costa Rican vs Immigrants from Lebanon In Labor Force | Age 16-19
COMPARE
Costa Rican
Immigrants from Lebanon
In Labor Force | Age 16-19
In Labor Force | Age 16-19 Comparison
Costa Ricans
Immigrants from Lebanon
36.3%
IN LABOR FORCE | AGE 16-19
36.1/ 100
METRIC RATING
184th/ 347
METRIC RANK
35.2%
IN LABOR FORCE | AGE 16-19
5.0/ 100
METRIC RATING
229th/ 347
METRIC RANK
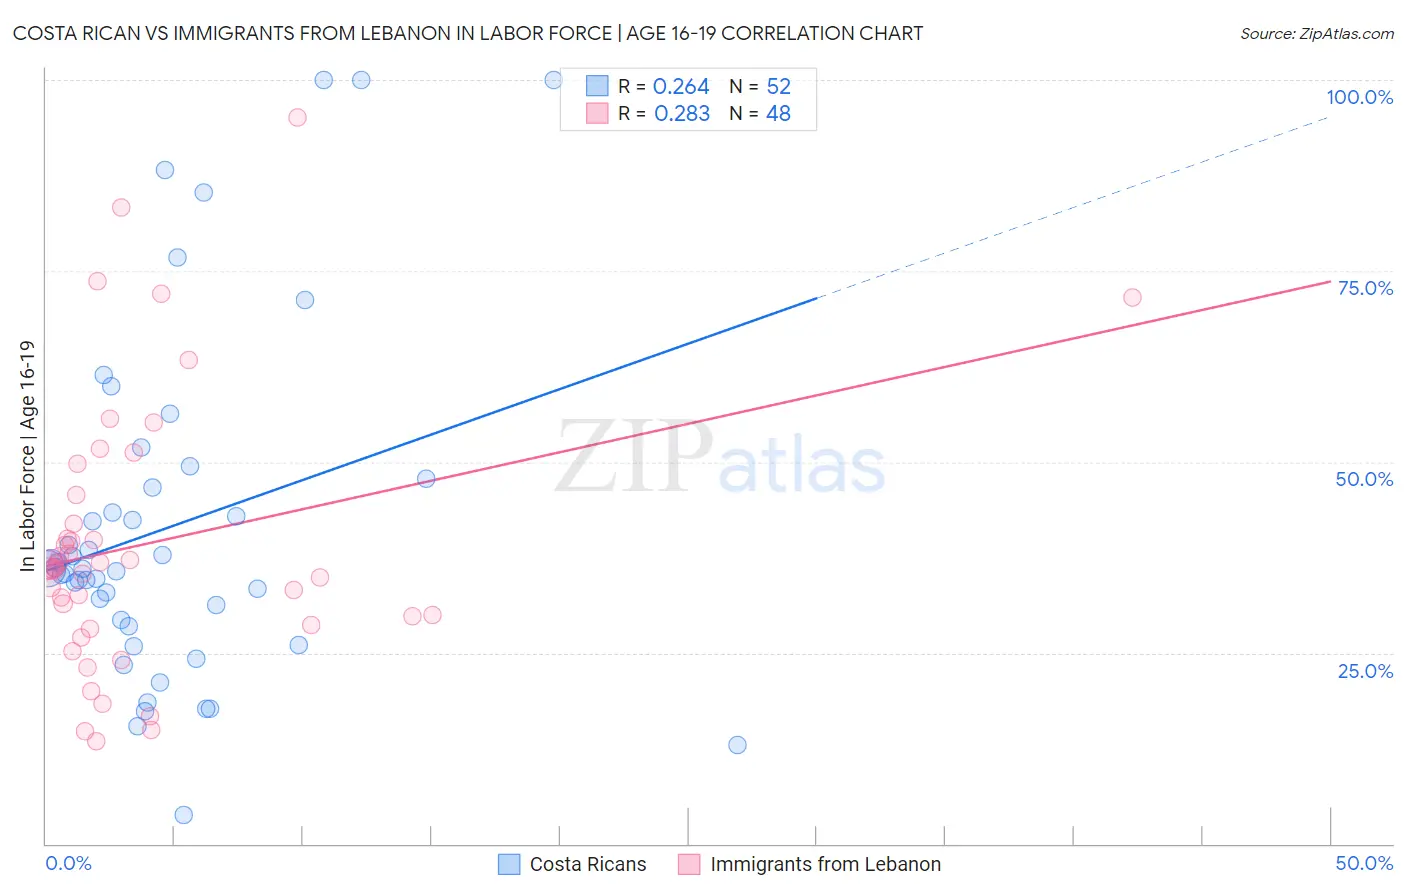
Costa Rican vs Immigrants from Lebanon In Labor Force | Age 16-19 Correlation Chart
The statistical analysis conducted on geographies consisting of 253,483,073 people shows a weak positive correlation between the proportion of Costa Ricans and labor force participation rate among population between the ages 16 and 19 in the United States with a correlation coefficient (R) of 0.264 and weighted average of 36.3%. Similarly, the statistical analysis conducted on geographies consisting of 217,008,802 people shows a weak positive correlation between the proportion of Immigrants from Lebanon and labor force participation rate among population between the ages 16 and 19 in the United States with a correlation coefficient (R) of 0.283 and weighted average of 35.2%, a difference of 3.1%.
In Labor Force | Age 16-19 Correlation Summary
| Measurement | Costa Rican | Immigrants from Lebanon |
| Minimum | 3.7% | 13.4% |
| Maximum | 100.0% | 95.1% |
| Range | 96.3% | 81.7% |
| Mean | 41.5% | 39.2% |
| Median | 36.0% | 36.1% |
| Interquartile 25% (IQ1) | 28.9% | 29.2% |
| Interquartile 75% (IQ3) | 47.2% | 43.8% |
| Interquartile Range (IQR) | 18.3% | 14.6% |
| Standard Deviation (Sample) | 22.4% | 17.7% |
| Standard Deviation (Population) | 22.2% | 17.5% |
Similar Demographics by In Labor Force | Age 16-19
Demographics Similar to Costa Ricans by In Labor Force | Age 16-19
In terms of in labor force | age 16-19, the demographic groups most similar to Costa Ricans are Bhutanese (36.3%, a difference of 0.040%), Immigrants from Romania (36.3%, a difference of 0.12%), Immigrants from Afghanistan (36.3%, a difference of 0.12%), Eastern European (36.4%, a difference of 0.15%), and Immigrants from Italy (36.4%, a difference of 0.16%).
| Demographics | Rating | Rank | In Labor Force | Age 16-19 |
| Immigrants | Northern Europe | 46.6 /100 | #177 | Average 36.5% |
| Blacks/African Americans | 45.1 /100 | #178 | Average 36.5% |
| Immigrants | Southern Europe | 43.3 /100 | #179 | Average 36.4% |
| Immigrants | Morocco | 41.1 /100 | #180 | Average 36.4% |
| Jordanians | 39.6 /100 | #181 | Fair 36.4% |
| Immigrants | Italy | 39.1 /100 | #182 | Fair 36.4% |
| Eastern Europeans | 38.8 /100 | #183 | Fair 36.4% |
| Costa Ricans | 36.1 /100 | #184 | Fair 36.3% |
| Bhutanese | 35.3 /100 | #185 | Fair 36.3% |
| Immigrants | Romania | 34.0 /100 | #186 | Fair 36.3% |
| Immigrants | Afghanistan | 34.0 /100 | #187 | Fair 36.3% |
| Immigrants | Europe | 31.8 /100 | #188 | Fair 36.2% |
| Immigrants | Hungary | 28.8 /100 | #189 | Fair 36.2% |
| Panamanians | 28.6 /100 | #190 | Fair 36.1% |
| Immigrants | Croatia | 27.5 /100 | #191 | Fair 36.1% |
Demographics Similar to Immigrants from Lebanon by In Labor Force | Age 16-19
In terms of in labor force | age 16-19, the demographic groups most similar to Immigrants from Lebanon are Immigrants from Honduras (35.2%, a difference of 0.030%), Immigrants from Senegal (35.3%, a difference of 0.13%), Immigrants from Syria (35.2%, a difference of 0.15%), Immigrants from Kazakhstan (35.2%, a difference of 0.16%), and Mongolian (35.3%, a difference of 0.18%).
| Demographics | Rating | Rank | In Labor Force | Age 16-19 |
| Immigrants | Ghana | 7.3 /100 | #222 | Tragic 35.4% |
| Ghanaians | 6.5 /100 | #223 | Tragic 35.3% |
| Hondurans | 6.5 /100 | #224 | Tragic 35.3% |
| Immigrants | Belgium | 6.1 /100 | #225 | Tragic 35.3% |
| Immigrants | Guatemala | 5.7 /100 | #226 | Tragic 35.3% |
| Mongolians | 5.7 /100 | #227 | Tragic 35.3% |
| Immigrants | Senegal | 5.5 /100 | #228 | Tragic 35.3% |
| Immigrants | Lebanon | 5.0 /100 | #229 | Tragic 35.2% |
| Immigrants | Honduras | 4.9 /100 | #230 | Tragic 35.2% |
| Immigrants | Syria | 4.5 /100 | #231 | Tragic 35.2% |
| Immigrants | Kazakhstan | 4.5 /100 | #232 | Tragic 35.2% |
| Immigrants | France | 4.3 /100 | #233 | Tragic 35.1% |
| Immigrants | Mexico | 4.2 /100 | #234 | Tragic 35.1% |
| Immigrants | Philippines | 4.0 /100 | #235 | Tragic 35.1% |
| Immigrants | Australia | 3.6 /100 | #236 | Tragic 35.1% |