Immigrants from Albania vs Immigrants from Lebanon In Labor Force | Age 16-19
COMPARE
Immigrants from Albania
Immigrants from Lebanon
In Labor Force | Age 16-19
In Labor Force | Age 16-19 Comparison
Immigrants from Albania
Immigrants from Lebanon
35.8%
IN LABOR FORCE | AGE 16-19
15.0/ 100
METRIC RATING
204th/ 347
METRIC RANK
35.2%
IN LABOR FORCE | AGE 16-19
5.0/ 100
METRIC RATING
229th/ 347
METRIC RANK
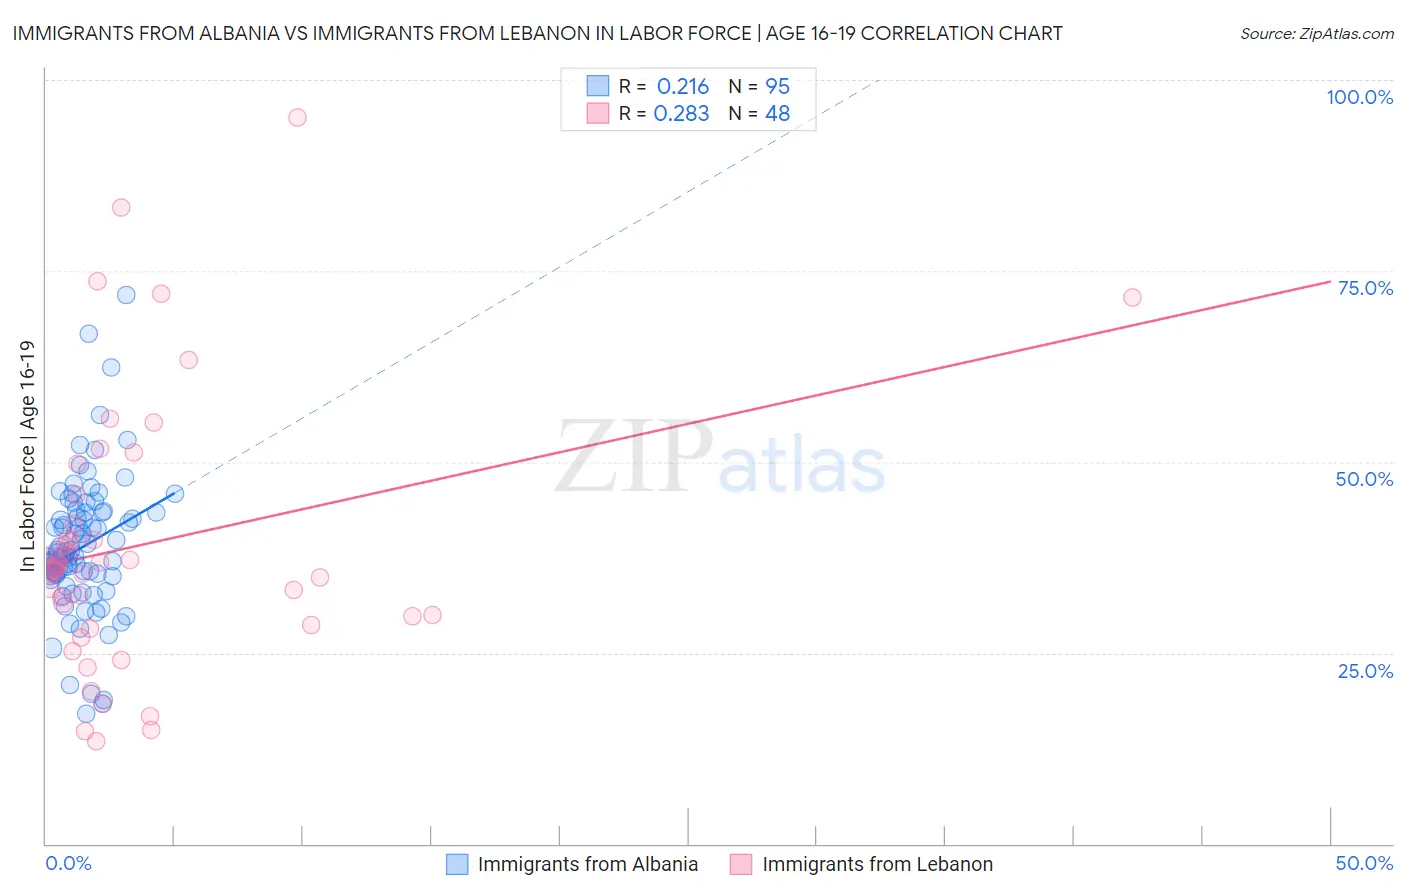
Immigrants from Albania vs Immigrants from Lebanon In Labor Force | Age 16-19 Correlation Chart
The statistical analysis conducted on geographies consisting of 119,330,257 people shows a weak positive correlation between the proportion of Immigrants from Albania and labor force participation rate among population between the ages 16 and 19 in the United States with a correlation coefficient (R) of 0.216 and weighted average of 35.8%. Similarly, the statistical analysis conducted on geographies consisting of 217,008,802 people shows a weak positive correlation between the proportion of Immigrants from Lebanon and labor force participation rate among population between the ages 16 and 19 in the United States with a correlation coefficient (R) of 0.283 and weighted average of 35.2%, a difference of 1.6%.
In Labor Force | Age 16-19 Correlation Summary
| Measurement | Immigrants from Albania | Immigrants from Lebanon |
| Minimum | 17.1% | 13.4% |
| Maximum | 71.9% | 95.1% |
| Range | 54.8% | 81.7% |
| Mean | 38.8% | 39.2% |
| Median | 37.7% | 36.1% |
| Interquartile 25% (IQ1) | 35.1% | 29.2% |
| Interquartile 75% (IQ3) | 43.4% | 43.8% |
| Interquartile Range (IQR) | 8.3% | 14.6% |
| Standard Deviation (Sample) | 9.0% | 17.7% |
| Standard Deviation (Population) | 9.0% | 17.5% |
Similar Demographics by In Labor Force | Age 16-19
Demographics Similar to Immigrants from Albania by In Labor Force | Age 16-19
In terms of in labor force | age 16-19, the demographic groups most similar to Immigrants from Albania are South American Indian (35.8%, a difference of 0.040%), Chilean (35.8%, a difference of 0.040%), Immigrants from Eastern Europe (35.8%, a difference of 0.050%), Immigrants from Nigeria (35.8%, a difference of 0.17%), and Korean (35.7%, a difference of 0.17%).
| Demographics | Rating | Rank | In Labor Force | Age 16-19 |
| Immigrants | Serbia | 21.0 /100 | #197 | Fair 36.0% |
| Immigrants | Northern Africa | 19.9 /100 | #198 | Poor 35.9% |
| Immigrants | Norway | 19.8 /100 | #199 | Poor 35.9% |
| Immigrants | Sweden | 18.8 /100 | #200 | Poor 35.9% |
| Alsatians | 17.5 /100 | #201 | Poor 35.9% |
| Senegalese | 17.4 /100 | #202 | Poor 35.9% |
| Immigrants | Nigeria | 16.8 /100 | #203 | Poor 35.8% |
| Immigrants | Albania | 15.0 /100 | #204 | Poor 35.8% |
| South American Indians | 14.6 /100 | #205 | Poor 35.8% |
| Chileans | 14.6 /100 | #206 | Poor 35.8% |
| Immigrants | Eastern Europe | 14.5 /100 | #207 | Poor 35.8% |
| Koreans | 13.3 /100 | #208 | Poor 35.7% |
| Moroccans | 12.7 /100 | #209 | Poor 35.7% |
| Immigrants | Switzerland | 11.9 /100 | #210 | Poor 35.6% |
| Mexicans | 11.9 /100 | #211 | Poor 35.6% |
Demographics Similar to Immigrants from Lebanon by In Labor Force | Age 16-19
In terms of in labor force | age 16-19, the demographic groups most similar to Immigrants from Lebanon are Immigrants from Honduras (35.2%, a difference of 0.030%), Immigrants from Senegal (35.3%, a difference of 0.13%), Immigrants from Syria (35.2%, a difference of 0.15%), Immigrants from Kazakhstan (35.2%, a difference of 0.16%), and Mongolian (35.3%, a difference of 0.18%).
| Demographics | Rating | Rank | In Labor Force | Age 16-19 |
| Immigrants | Ghana | 7.3 /100 | #222 | Tragic 35.4% |
| Ghanaians | 6.5 /100 | #223 | Tragic 35.3% |
| Hondurans | 6.5 /100 | #224 | Tragic 35.3% |
| Immigrants | Belgium | 6.1 /100 | #225 | Tragic 35.3% |
| Immigrants | Guatemala | 5.7 /100 | #226 | Tragic 35.3% |
| Mongolians | 5.7 /100 | #227 | Tragic 35.3% |
| Immigrants | Senegal | 5.5 /100 | #228 | Tragic 35.3% |
| Immigrants | Lebanon | 5.0 /100 | #229 | Tragic 35.2% |
| Immigrants | Honduras | 4.9 /100 | #230 | Tragic 35.2% |
| Immigrants | Syria | 4.5 /100 | #231 | Tragic 35.2% |
| Immigrants | Kazakhstan | 4.5 /100 | #232 | Tragic 35.2% |
| Immigrants | France | 4.3 /100 | #233 | Tragic 35.1% |
| Immigrants | Mexico | 4.2 /100 | #234 | Tragic 35.1% |
| Immigrants | Philippines | 4.0 /100 | #235 | Tragic 35.1% |
| Immigrants | Australia | 3.6 /100 | #236 | Tragic 35.1% |