Costa Rican vs Immigrants from Lebanon Unemployment Among Seniors over 75 years
COMPARE
Costa Rican
Immigrants from Lebanon
Unemployment Among Seniors over 75 years
Unemployment Among Seniors over 75 years Comparison
Costa Ricans
Immigrants from Lebanon
9.1%
UNEMPLOYMENT AMONG SENIORS OVER 75 YEARS
6.3/ 100
METRIC RATING
224th/ 347
METRIC RANK
8.2%
UNEMPLOYMENT AMONG SENIORS OVER 75 YEARS
98.8/ 100
METRIC RATING
109th/ 347
METRIC RANK
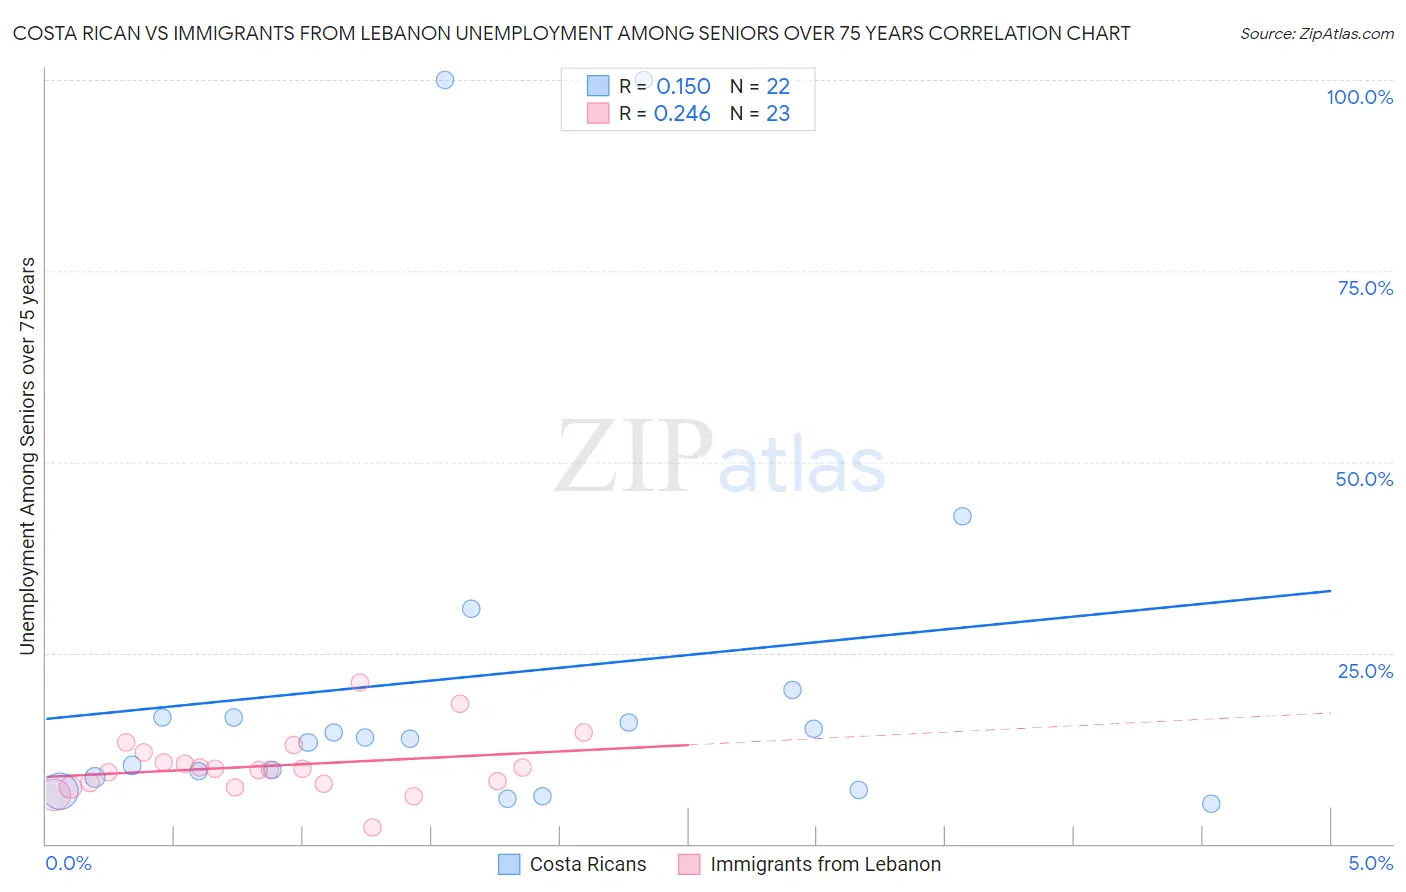
Costa Rican vs Immigrants from Lebanon Unemployment Among Seniors over 75 years Correlation Chart
The statistical analysis conducted on geographies consisting of 153,154,168 people shows a poor positive correlation between the proportion of Costa Ricans and unemployment rate among seniors over the age of 75 in the United States with a correlation coefficient (R) of 0.150 and weighted average of 9.1%. Similarly, the statistical analysis conducted on geographies consisting of 140,513,060 people shows a weak positive correlation between the proportion of Immigrants from Lebanon and unemployment rate among seniors over the age of 75 in the United States with a correlation coefficient (R) of 0.246 and weighted average of 8.2%, a difference of 10.1%.
Unemployment Among Seniors over 75 years Correlation Summary
| Measurement | Costa Rican | Immigrants from Lebanon |
| Minimum | 5.3% | 2.1% |
| Maximum | 100.0% | 21.0% |
| Range | 94.7% | 18.9% |
| Mean | 21.9% | 10.2% |
| Median | 13.8% | 9.8% |
| Interquartile 25% (IQ1) | 8.7% | 7.9% |
| Interquartile 75% (IQ3) | 16.6% | 11.9% |
| Interquartile Range (IQR) | 7.9% | 4.0% |
| Standard Deviation (Sample) | 26.7% | 4.0% |
| Standard Deviation (Population) | 26.1% | 3.9% |
Similar Demographics by Unemployment Among Seniors over 75 years
Demographics Similar to Costa Ricans by Unemployment Among Seniors over 75 years
In terms of unemployment among seniors over 75 years, the demographic groups most similar to Costa Ricans are Navajo (9.1%, a difference of 0.040%), Immigrants from Bangladesh (9.1%, a difference of 0.090%), Immigrants from Jordan (9.0%, a difference of 0.14%), Samoan (9.1%, a difference of 0.14%), and Peruvian (9.0%, a difference of 0.20%).
| Demographics | Rating | Rank | Unemployment Among Seniors over 75 years |
| Lebanese | 11.1 /100 | #217 | Poor 9.0% |
| Immigrants | Africa | 9.7 /100 | #218 | Tragic 9.0% |
| Afghans | 8.3 /100 | #219 | Tragic 9.0% |
| Immigrants | Zimbabwe | 7.8 /100 | #220 | Tragic 9.0% |
| Guamanians/Chamorros | 7.7 /100 | #221 | Tragic 9.0% |
| Peruvians | 7.3 /100 | #222 | Tragic 9.0% |
| Immigrants | Jordan | 6.9 /100 | #223 | Tragic 9.0% |
| Costa Ricans | 6.3 /100 | #224 | Tragic 9.1% |
| Navajo | 6.1 /100 | #225 | Tragic 9.1% |
| Immigrants | Bangladesh | 5.9 /100 | #226 | Tragic 9.1% |
| Samoans | 5.7 /100 | #227 | Tragic 9.1% |
| Kenyans | 5.4 /100 | #228 | Tragic 9.1% |
| Hispanics or Latinos | 5.0 /100 | #229 | Tragic 9.1% |
| Northern Europeans | 4.9 /100 | #230 | Tragic 9.1% |
| Immigrants | Central America | 4.9 /100 | #231 | Tragic 9.1% |
Demographics Similar to Immigrants from Lebanon by Unemployment Among Seniors over 75 years
In terms of unemployment among seniors over 75 years, the demographic groups most similar to Immigrants from Lebanon are Laotian (8.2%, a difference of 0.020%), Marshallese (8.2%, a difference of 0.030%), French American Indian (8.2%, a difference of 0.070%), Sri Lankan (8.2%, a difference of 0.15%), and Immigrants from India (8.2%, a difference of 0.20%).
| Demographics | Rating | Rank | Unemployment Among Seniors over 75 years |
| Immigrants | Panama | 99.1 /100 | #102 | Exceptional 8.2% |
| South American Indians | 99.1 /100 | #103 | Exceptional 8.2% |
| Immigrants | South Central Asia | 99.0 /100 | #104 | Exceptional 8.2% |
| Immigrants | Caribbean | 99.0 /100 | #105 | Exceptional 8.2% |
| Immigrants | Honduras | 99.0 /100 | #106 | Exceptional 8.2% |
| Sri Lankans | 98.9 /100 | #107 | Exceptional 8.2% |
| Laotians | 98.8 /100 | #108 | Exceptional 8.2% |
| Immigrants | Lebanon | 98.8 /100 | #109 | Exceptional 8.2% |
| Marshallese | 98.7 /100 | #110 | Exceptional 8.2% |
| French American Indians | 98.7 /100 | #111 | Exceptional 8.2% |
| Immigrants | India | 98.6 /100 | #112 | Exceptional 8.2% |
| Asians | 98.5 /100 | #113 | Exceptional 8.3% |
| Trinidadians and Tobagonians | 98.4 /100 | #114 | Exceptional 8.3% |
| Sudanese | 98.2 /100 | #115 | Exceptional 8.3% |
| Immigrants | West Indies | 98.1 /100 | #116 | Exceptional 8.3% |