Costa Rican vs Immigrants from Syria In Labor Force | Age 35-44
COMPARE
Costa Rican
Immigrants from Syria
In Labor Force | Age 35-44
In Labor Force | Age 35-44 Comparison
Costa Ricans
Immigrants from Syria
84.3%
IN LABOR FORCE | AGE 35-44
35.3/ 100
METRIC RATING
185th/ 347
METRIC RANK
83.9%
IN LABOR FORCE | AGE 35-44
2.5/ 100
METRIC RATING
235th/ 347
METRIC RANK
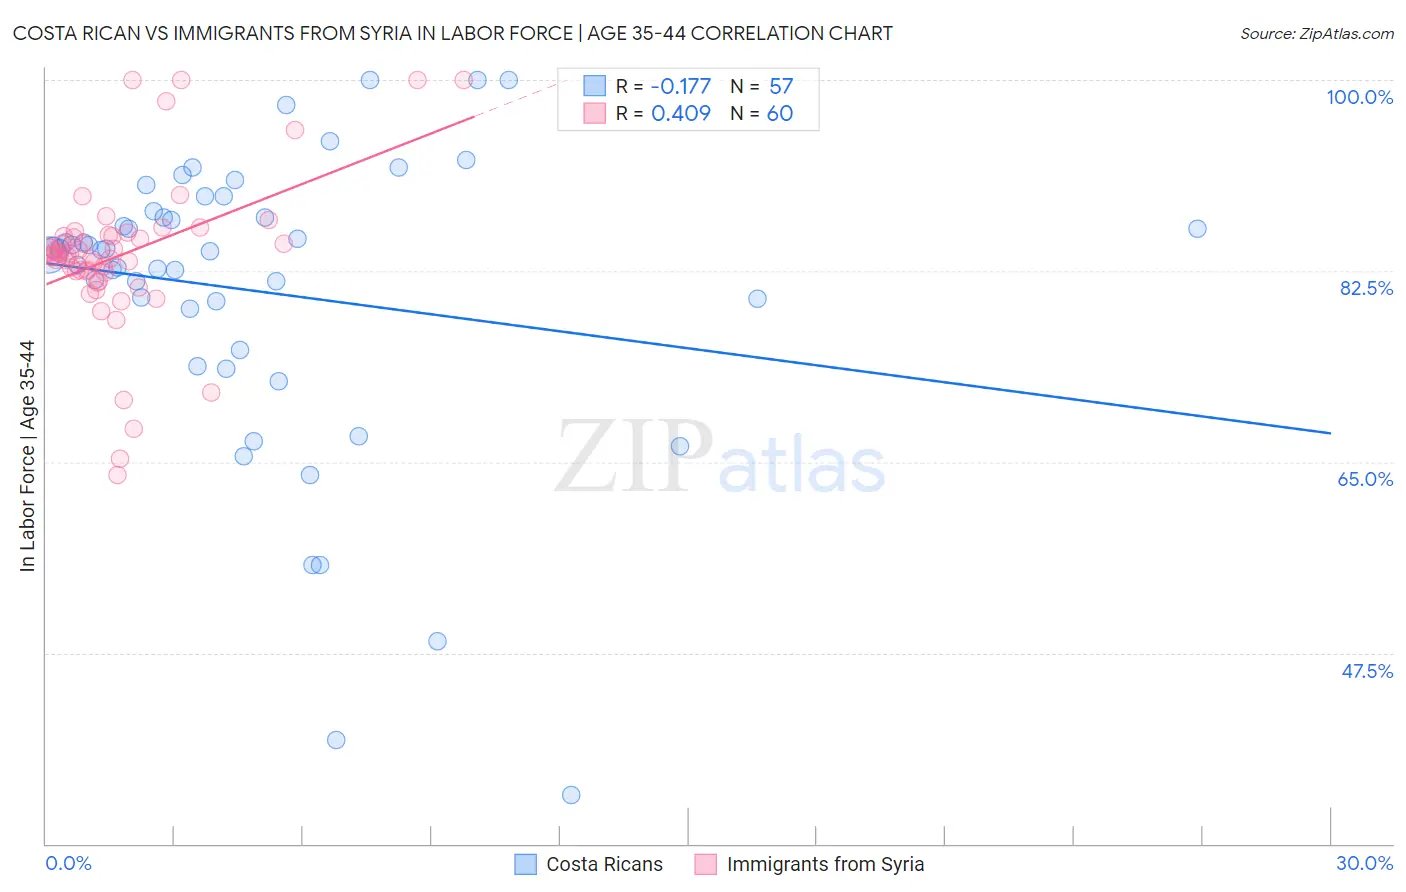
Costa Rican vs Immigrants from Syria In Labor Force | Age 35-44 Correlation Chart
The statistical analysis conducted on geographies consisting of 253,534,047 people shows a poor negative correlation between the proportion of Costa Ricans and labor force participation rate among population between the ages 35 and 44 in the United States with a correlation coefficient (R) of -0.177 and weighted average of 84.3%. Similarly, the statistical analysis conducted on geographies consisting of 174,102,853 people shows a moderate positive correlation between the proportion of Immigrants from Syria and labor force participation rate among population between the ages 35 and 44 in the United States with a correlation coefficient (R) of 0.409 and weighted average of 83.9%, a difference of 0.50%.
In Labor Force | Age 35-44 Correlation Summary
| Measurement | Costa Rican | Immigrants from Syria |
| Minimum | 34.5% | 63.8% |
| Maximum | 100.0% | 100.0% |
| Range | 65.5% | 36.2% |
| Mean | 80.6% | 84.0% |
| Median | 84.4% | 84.0% |
| Interquartile 25% (IQ1) | 77.2% | 82.4% |
| Interquartile 75% (IQ3) | 87.7% | 85.7% |
| Interquartile Range (IQR) | 10.6% | 3.3% |
| Standard Deviation (Sample) | 13.6% | 7.1% |
| Standard Deviation (Population) | 13.5% | 7.0% |
Similar Demographics by In Labor Force | Age 35-44
Demographics Similar to Costa Ricans by In Labor Force | Age 35-44
In terms of in labor force | age 35-44, the demographic groups most similar to Costa Ricans are Armenian (84.3%, a difference of 0.0%), Australian (84.3%, a difference of 0.0%), Dutch (84.3%, a difference of 0.0%), Immigrants from West Indies (84.3%, a difference of 0.010%), and Korean (84.3%, a difference of 0.010%).
| Demographics | Rating | Rank | In Labor Force | Age 35-44 |
| Northern Europeans | 44.1 /100 | #178 | Average 84.3% |
| Immigrants | South Africa | 42.8 /100 | #179 | Average 84.3% |
| Danes | 38.8 /100 | #180 | Fair 84.3% |
| Immigrants | West Indies | 36.4 /100 | #181 | Fair 84.3% |
| Koreans | 36.3 /100 | #182 | Fair 84.3% |
| Barbadians | 36.2 /100 | #183 | Fair 84.3% |
| Armenians | 35.6 /100 | #184 | Fair 84.3% |
| Costa Ricans | 35.3 /100 | #185 | Fair 84.3% |
| Australians | 35.1 /100 | #186 | Fair 84.3% |
| Dutch | 34.8 /100 | #187 | Fair 84.3% |
| South Africans | 34.1 /100 | #188 | Fair 84.3% |
| Immigrants | Denmark | 33.7 /100 | #189 | Fair 84.3% |
| Portuguese | 31.9 /100 | #190 | Fair 84.3% |
| Immigrants | Philippines | 27.9 /100 | #191 | Fair 84.2% |
| Immigrants | Vietnam | 27.4 /100 | #192 | Fair 84.2% |
Demographics Similar to Immigrants from Syria by In Labor Force | Age 35-44
In terms of in labor force | age 35-44, the demographic groups most similar to Immigrants from Syria are West Indian (83.9%, a difference of 0.0%), Immigrants from Oceania (83.9%, a difference of 0.010%), Immigrants from Germany (83.9%, a difference of 0.020%), Native Hawaiian (83.9%, a difference of 0.030%), and Scottish (83.9%, a difference of 0.040%).
| Demographics | Rating | Rank | In Labor Force | Age 35-44 |
| Welsh | 5.3 /100 | #228 | Tragic 84.0% |
| Immigrants | Thailand | 4.7 /100 | #229 | Tragic 84.0% |
| Immigrants | Iraq | 3.7 /100 | #230 | Tragic 83.9% |
| Scottish | 3.2 /100 | #231 | Tragic 83.9% |
| Native Hawaiians | 3.0 /100 | #232 | Tragic 83.9% |
| Immigrants | Germany | 2.8 /100 | #233 | Tragic 83.9% |
| Immigrants | Oceania | 2.6 /100 | #234 | Tragic 83.9% |
| Immigrants | Syria | 2.5 /100 | #235 | Tragic 83.9% |
| West Indians | 2.4 /100 | #236 | Tragic 83.9% |
| English | 1.8 /100 | #237 | Tragic 83.8% |
| Immigrants | Laos | 1.7 /100 | #238 | Tragic 83.8% |
| Celtics | 1.4 /100 | #239 | Tragic 83.8% |
| Arabs | 1.3 /100 | #240 | Tragic 83.8% |
| Iraqis | 1.3 /100 | #241 | Tragic 83.8% |
| Immigrants | Cambodia | 1.1 /100 | #242 | Tragic 83.8% |