Chippewa vs Paraguayan In Labor Force | Age 45-54
COMPARE
Chippewa
Paraguayan
In Labor Force | Age 45-54
In Labor Force | Age 45-54 Comparison
Chippewa
Paraguayans
81.3%
IN LABOR FORCE | AGE 45-54
0.0/ 100
METRIC RATING
273rd/ 347
METRIC RANK
83.5%
IN LABOR FORCE | AGE 45-54
98.5/ 100
METRIC RATING
57th/ 347
METRIC RANK
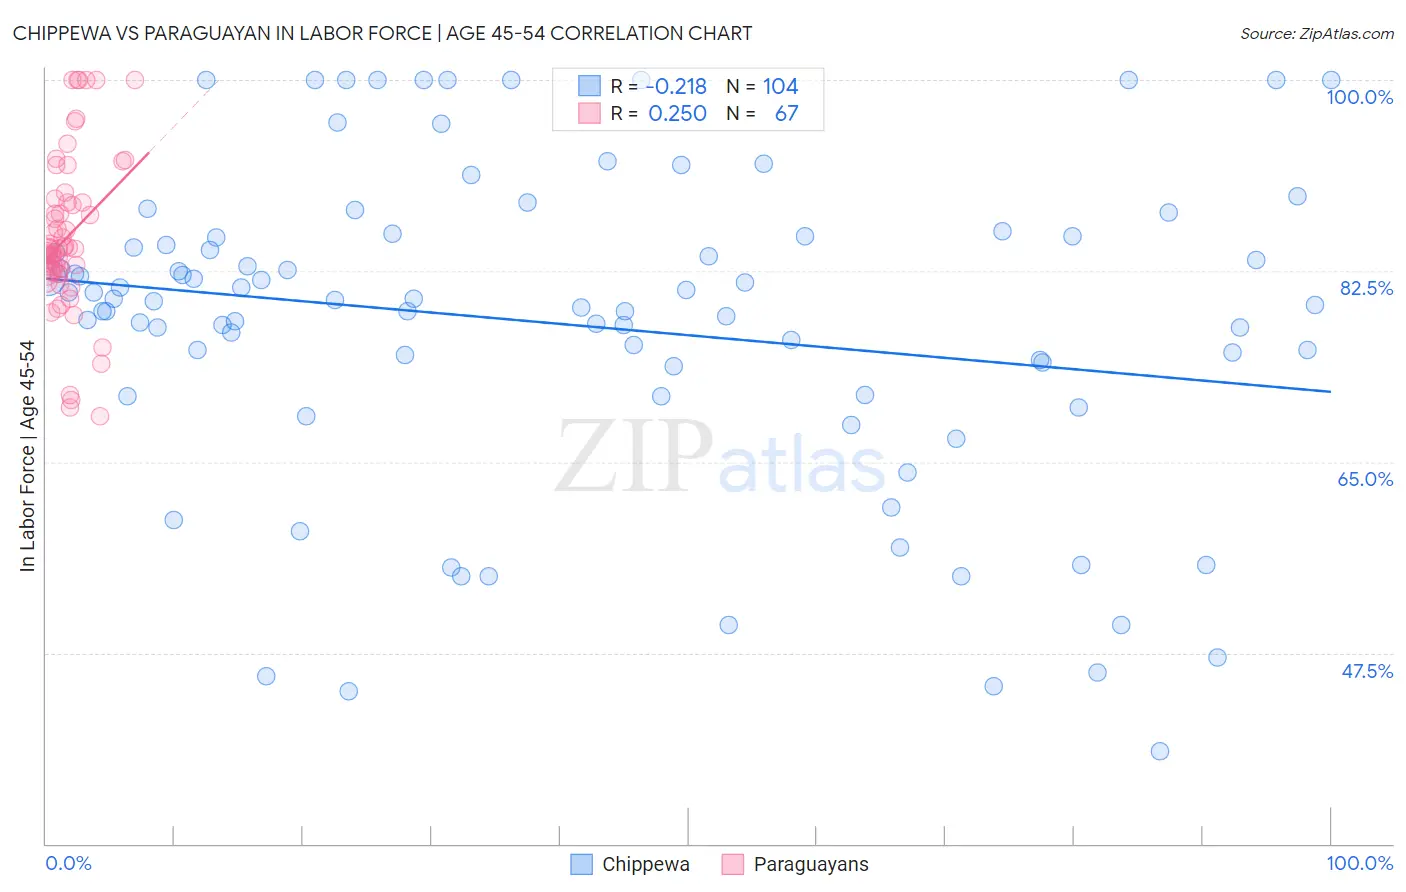
Chippewa vs Paraguayan In Labor Force | Age 45-54 Correlation Chart
The statistical analysis conducted on geographies consisting of 214,988,239 people shows a weak negative correlation between the proportion of Chippewa and labor force participation rate among population between the ages 45 and 54 in the United States with a correlation coefficient (R) of -0.218 and weighted average of 81.3%. Similarly, the statistical analysis conducted on geographies consisting of 95,100,902 people shows a weak positive correlation between the proportion of Paraguayans and labor force participation rate among population between the ages 45 and 54 in the United States with a correlation coefficient (R) of 0.250 and weighted average of 83.5%, a difference of 2.8%.
In Labor Force | Age 45-54 Correlation Summary
| Measurement | Chippewa | Paraguayan |
| Minimum | 38.5% | 69.2% |
| Maximum | 100.0% | 100.0% |
| Range | 61.5% | 30.8% |
| Mean | 77.6% | 85.6% |
| Median | 79.8% | 84.5% |
| Interquartile 25% (IQ1) | 72.5% | 82.2% |
| Interquartile 75% (IQ3) | 85.6% | 88.8% |
| Interquartile Range (IQR) | 13.2% | 6.6% |
| Standard Deviation (Sample) | 14.6% | 7.2% |
| Standard Deviation (Population) | 14.5% | 7.2% |
Similar Demographics by In Labor Force | Age 45-54
Demographics Similar to Chippewa by In Labor Force | Age 45-54
In terms of in labor force | age 45-54, the demographic groups most similar to Chippewa are British West Indian (81.2%, a difference of 0.030%), Nonimmigrants (81.2%, a difference of 0.040%), Spanish (81.3%, a difference of 0.060%), Bangladeshi (81.3%, a difference of 0.070%), and Immigrants from Barbados (81.3%, a difference of 0.070%).
| Demographics | Rating | Rank | In Labor Force | Age 45-54 |
| Immigrants | St. Vincent and the Grenadines | 0.1 /100 | #266 | Tragic 81.4% |
| West Indians | 0.1 /100 | #267 | Tragic 81.4% |
| Immigrants | Honduras | 0.0 /100 | #268 | Tragic 81.4% |
| Alsatians | 0.0 /100 | #269 | Tragic 81.3% |
| Bangladeshis | 0.0 /100 | #270 | Tragic 81.3% |
| Immigrants | Barbados | 0.0 /100 | #271 | Tragic 81.3% |
| Spanish | 0.0 /100 | #272 | Tragic 81.3% |
| Chippewa | 0.0 /100 | #273 | Tragic 81.3% |
| British West Indians | 0.0 /100 | #274 | Tragic 81.2% |
| Immigrants | Nonimmigrants | 0.0 /100 | #275 | Tragic 81.2% |
| U.S. Virgin Islanders | 0.0 /100 | #276 | Tragic 81.2% |
| Guatemalans | 0.0 /100 | #277 | Tragic 81.2% |
| Immigrants | Guatemala | 0.0 /100 | #278 | Tragic 81.1% |
| Immigrants | Micronesia | 0.0 /100 | #279 | Tragic 81.1% |
| Immigrants | Latin America | 0.0 /100 | #280 | Tragic 81.0% |
Demographics Similar to Paraguayans by In Labor Force | Age 45-54
In terms of in labor force | age 45-54, the demographic groups most similar to Paraguayans are Immigrants from Peru (83.5%, a difference of 0.010%), Eastern European (83.5%, a difference of 0.010%), Macedonian (83.5%, a difference of 0.020%), Somali (83.5%, a difference of 0.030%), and Bhutanese (83.5%, a difference of 0.030%).
| Demographics | Rating | Rank | In Labor Force | Age 45-54 |
| Immigrants | Greece | 98.8 /100 | #50 | Exceptional 83.6% |
| Immigrants | Turkey | 98.8 /100 | #51 | Exceptional 83.6% |
| Poles | 98.7 /100 | #52 | Exceptional 83.6% |
| Peruvians | 98.7 /100 | #53 | Exceptional 83.6% |
| Somalis | 98.7 /100 | #54 | Exceptional 83.5% |
| Macedonians | 98.7 /100 | #55 | Exceptional 83.5% |
| Immigrants | Peru | 98.6 /100 | #56 | Exceptional 83.5% |
| Paraguayans | 98.5 /100 | #57 | Exceptional 83.5% |
| Eastern Europeans | 98.5 /100 | #58 | Exceptional 83.5% |
| Bhutanese | 98.3 /100 | #59 | Exceptional 83.5% |
| Carpatho Rusyns | 98.3 /100 | #60 | Exceptional 83.5% |
| Filipinos | 98.3 /100 | #61 | Exceptional 83.5% |
| Immigrants | Taiwan | 98.0 /100 | #62 | Exceptional 83.5% |
| Afghans | 97.9 /100 | #63 | Exceptional 83.5% |
| Immigrants | Kenya | 97.9 /100 | #64 | Exceptional 83.5% |