Chippewa vs Haitian In Labor Force | Age 45-54
COMPARE
Chippewa
Haitian
In Labor Force | Age 45-54
In Labor Force | Age 45-54 Comparison
Chippewa
Haitians
81.3%
IN LABOR FORCE | AGE 45-54
0.0/ 100
METRIC RATING
273rd/ 347
METRIC RANK
82.8%
IN LABOR FORCE | AGE 45-54
61.8/ 100
METRIC RATING
162nd/ 347
METRIC RANK
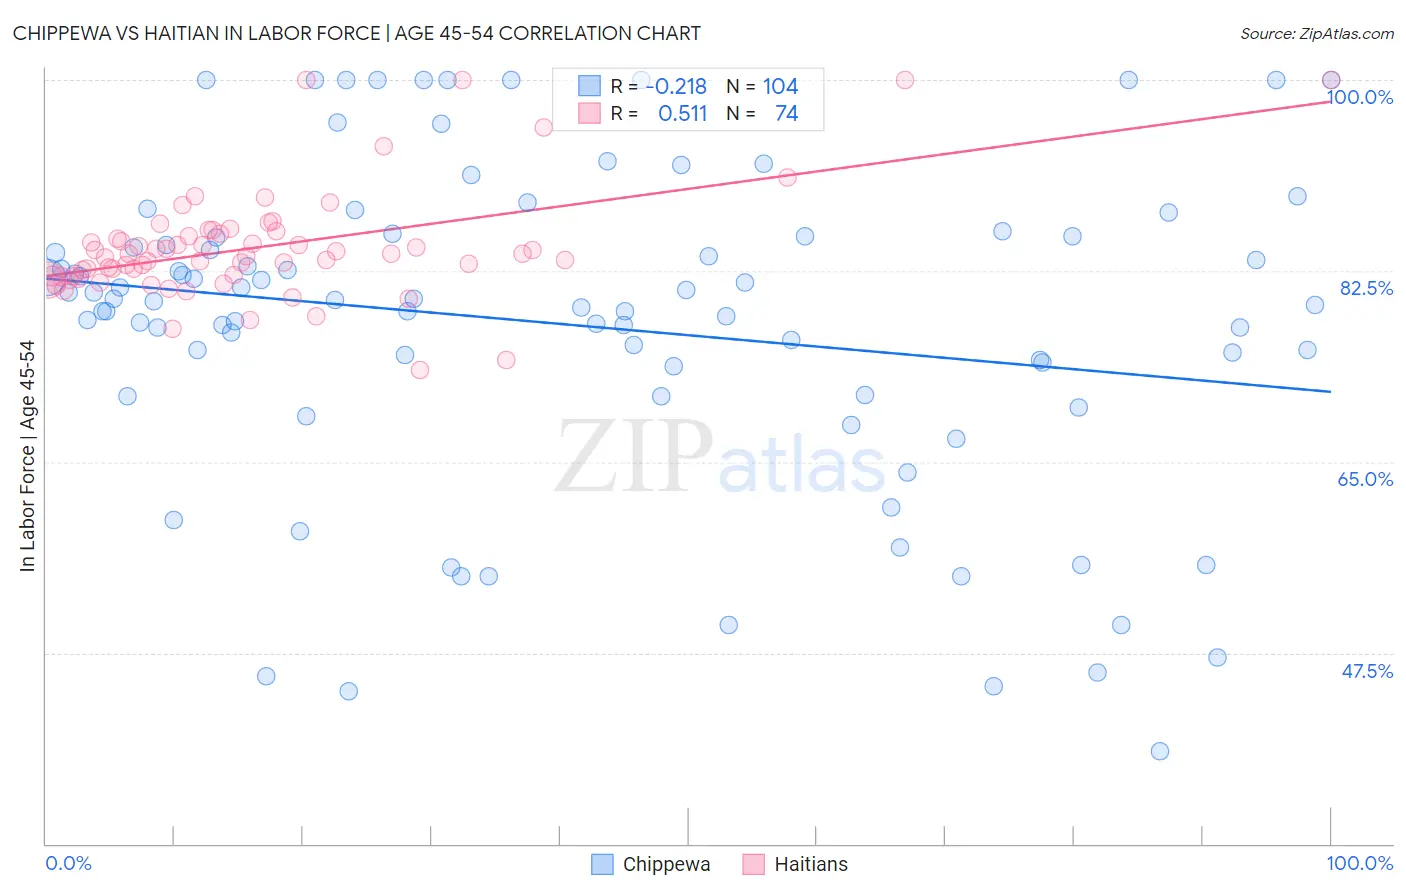
Chippewa vs Haitian In Labor Force | Age 45-54 Correlation Chart
The statistical analysis conducted on geographies consisting of 214,988,239 people shows a weak negative correlation between the proportion of Chippewa and labor force participation rate among population between the ages 45 and 54 in the United States with a correlation coefficient (R) of -0.218 and weighted average of 81.3%. Similarly, the statistical analysis conducted on geographies consisting of 287,703,107 people shows a substantial positive correlation between the proportion of Haitians and labor force participation rate among population between the ages 45 and 54 in the United States with a correlation coefficient (R) of 0.511 and weighted average of 82.8%, a difference of 1.9%.
In Labor Force | Age 45-54 Correlation Summary
| Measurement | Chippewa | Haitian |
| Minimum | 38.5% | 73.4% |
| Maximum | 100.0% | 100.0% |
| Range | 61.5% | 26.6% |
| Mean | 77.6% | 84.7% |
| Median | 79.8% | 84.0% |
| Interquartile 25% (IQ1) | 72.5% | 82.0% |
| Interquartile 75% (IQ3) | 85.6% | 85.9% |
| Interquartile Range (IQR) | 13.2% | 3.9% |
| Standard Deviation (Sample) | 14.6% | 5.1% |
| Standard Deviation (Population) | 14.5% | 5.1% |
Similar Demographics by In Labor Force | Age 45-54
Demographics Similar to Chippewa by In Labor Force | Age 45-54
In terms of in labor force | age 45-54, the demographic groups most similar to Chippewa are British West Indian (81.2%, a difference of 0.030%), Nonimmigrants (81.2%, a difference of 0.040%), Spanish (81.3%, a difference of 0.060%), Bangladeshi (81.3%, a difference of 0.070%), and Immigrants from Barbados (81.3%, a difference of 0.070%).
| Demographics | Rating | Rank | In Labor Force | Age 45-54 |
| Immigrants | St. Vincent and the Grenadines | 0.1 /100 | #266 | Tragic 81.4% |
| West Indians | 0.1 /100 | #267 | Tragic 81.4% |
| Immigrants | Honduras | 0.0 /100 | #268 | Tragic 81.4% |
| Alsatians | 0.0 /100 | #269 | Tragic 81.3% |
| Bangladeshis | 0.0 /100 | #270 | Tragic 81.3% |
| Immigrants | Barbados | 0.0 /100 | #271 | Tragic 81.3% |
| Spanish | 0.0 /100 | #272 | Tragic 81.3% |
| Chippewa | 0.0 /100 | #273 | Tragic 81.3% |
| British West Indians | 0.0 /100 | #274 | Tragic 81.2% |
| Immigrants | Nonimmigrants | 0.0 /100 | #275 | Tragic 81.2% |
| U.S. Virgin Islanders | 0.0 /100 | #276 | Tragic 81.2% |
| Guatemalans | 0.0 /100 | #277 | Tragic 81.2% |
| Immigrants | Guatemala | 0.0 /100 | #278 | Tragic 81.1% |
| Immigrants | Micronesia | 0.0 /100 | #279 | Tragic 81.1% |
| Immigrants | Latin America | 0.0 /100 | #280 | Tragic 81.0% |
Demographics Similar to Haitians by In Labor Force | Age 45-54
In terms of in labor force | age 45-54, the demographic groups most similar to Haitians are South American Indian (82.9%, a difference of 0.0%), Dutch (82.8%, a difference of 0.0%), German Russian (82.8%, a difference of 0.0%), Laotian (82.9%, a difference of 0.010%), and Immigrants from Sudan (82.8%, a difference of 0.020%).
| Demographics | Rating | Rank | In Labor Force | Age 45-54 |
| Immigrants | Philippines | 69.0 /100 | #155 | Good 82.9% |
| Immigrants | Saudi Arabia | 68.8 /100 | #156 | Good 82.9% |
| Immigrants | Australia | 68.2 /100 | #157 | Good 82.9% |
| Immigrants | Southern Europe | 67.8 /100 | #158 | Good 82.9% |
| Immigrants | Austria | 64.6 /100 | #159 | Good 82.9% |
| Laotians | 62.8 /100 | #160 | Good 82.9% |
| South American Indians | 62.2 /100 | #161 | Good 82.9% |
| Haitians | 61.8 /100 | #162 | Good 82.8% |
| Dutch | 61.7 /100 | #163 | Good 82.8% |
| German Russians | 61.3 /100 | #164 | Good 82.8% |
| Immigrants | Sudan | 59.9 /100 | #165 | Average 82.8% |
| Immigrants | South Eastern Asia | 57.4 /100 | #166 | Average 82.8% |
| Swiss | 56.5 /100 | #167 | Average 82.8% |
| Immigrants | South Africa | 55.8 /100 | #168 | Average 82.8% |
| Immigrants | Western Africa | 54.1 /100 | #169 | Average 82.8% |