Immigrants from Uruguay vs Paraguayan In Labor Force | Age 45-54
COMPARE
Immigrants from Uruguay
Paraguayan
In Labor Force | Age 45-54
In Labor Force | Age 45-54 Comparison
Immigrants from Uruguay
Paraguayans
83.2%
IN LABOR FORCE | AGE 45-54
90.2/ 100
METRIC RATING
119th/ 347
METRIC RANK
83.5%
IN LABOR FORCE | AGE 45-54
98.5/ 100
METRIC RATING
57th/ 347
METRIC RANK
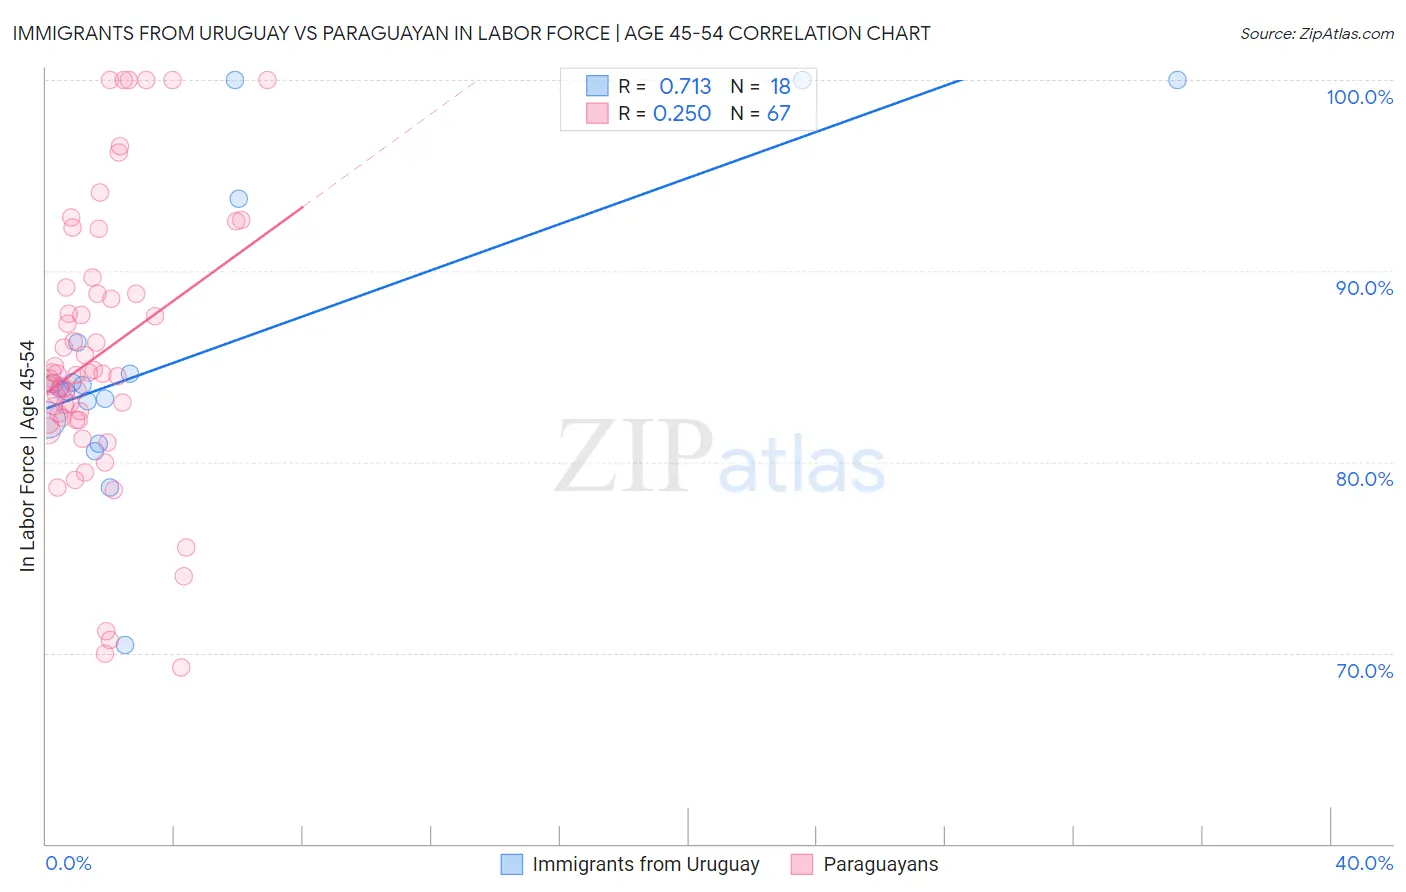
Immigrants from Uruguay vs Paraguayan In Labor Force | Age 45-54 Correlation Chart
The statistical analysis conducted on geographies consisting of 133,245,142 people shows a strong positive correlation between the proportion of Immigrants from Uruguay and labor force participation rate among population between the ages 45 and 54 in the United States with a correlation coefficient (R) of 0.713 and weighted average of 83.2%. Similarly, the statistical analysis conducted on geographies consisting of 95,100,902 people shows a weak positive correlation between the proportion of Paraguayans and labor force participation rate among population between the ages 45 and 54 in the United States with a correlation coefficient (R) of 0.250 and weighted average of 83.5%, a difference of 0.43%.
In Labor Force | Age 45-54 Correlation Summary
| Measurement | Immigrants from Uruguay | Paraguayan |
| Minimum | 70.4% | 69.2% |
| Maximum | 100.0% | 100.0% |
| Range | 29.6% | 30.8% |
| Mean | 85.8% | 85.6% |
| Median | 83.9% | 84.5% |
| Interquartile 25% (IQ1) | 82.2% | 82.2% |
| Interquartile 75% (IQ3) | 86.2% | 88.8% |
| Interquartile Range (IQR) | 4.1% | 6.6% |
| Standard Deviation (Sample) | 7.9% | 7.2% |
| Standard Deviation (Population) | 7.6% | 7.2% |
Similar Demographics by In Labor Force | Age 45-54
Demographics Similar to Immigrants from Uruguay by In Labor Force | Age 45-54
In terms of in labor force | age 45-54, the demographic groups most similar to Immigrants from Uruguay are Immigrants from Russia (83.2%, a difference of 0.0%), Immigrants from Europe (83.2%, a difference of 0.010%), Immigrants from China (83.2%, a difference of 0.020%), Uruguayan (83.1%, a difference of 0.020%), and Immigrants from Malaysia (83.2%, a difference of 0.030%).
| Demographics | Rating | Rank | In Labor Force | Age 45-54 |
| Immigrants | Afghanistan | 92.4 /100 | #112 | Exceptional 83.2% |
| Immigrants | Albania | 91.8 /100 | #113 | Exceptional 83.2% |
| Assyrians/Chaldeans/Syriacs | 91.7 /100 | #114 | Exceptional 83.2% |
| Immigrants | Chile | 91.6 /100 | #115 | Exceptional 83.2% |
| Immigrants | Malaysia | 91.4 /100 | #116 | Exceptional 83.2% |
| Immigrants | China | 90.9 /100 | #117 | Exceptional 83.2% |
| Immigrants | Europe | 90.7 /100 | #118 | Exceptional 83.2% |
| Immigrants | Uruguay | 90.2 /100 | #119 | Exceptional 83.2% |
| Immigrants | Russia | 90.1 /100 | #120 | Exceptional 83.2% |
| Uruguayans | 89.4 /100 | #121 | Excellent 83.1% |
| Immigrants | Vietnam | 88.9 /100 | #122 | Excellent 83.1% |
| Tongans | 88.2 /100 | #123 | Excellent 83.1% |
| Bermudans | 88.0 /100 | #124 | Excellent 83.1% |
| Immigrants | Iran | 87.2 /100 | #125 | Excellent 83.1% |
| Immigrants | Belgium | 86.4 /100 | #126 | Excellent 83.1% |
Demographics Similar to Paraguayans by In Labor Force | Age 45-54
In terms of in labor force | age 45-54, the demographic groups most similar to Paraguayans are Immigrants from Peru (83.5%, a difference of 0.010%), Eastern European (83.5%, a difference of 0.010%), Macedonian (83.5%, a difference of 0.020%), Somali (83.5%, a difference of 0.030%), and Bhutanese (83.5%, a difference of 0.030%).
| Demographics | Rating | Rank | In Labor Force | Age 45-54 |
| Immigrants | Greece | 98.8 /100 | #50 | Exceptional 83.6% |
| Immigrants | Turkey | 98.8 /100 | #51 | Exceptional 83.6% |
| Poles | 98.7 /100 | #52 | Exceptional 83.6% |
| Peruvians | 98.7 /100 | #53 | Exceptional 83.6% |
| Somalis | 98.7 /100 | #54 | Exceptional 83.5% |
| Macedonians | 98.7 /100 | #55 | Exceptional 83.5% |
| Immigrants | Peru | 98.6 /100 | #56 | Exceptional 83.5% |
| Paraguayans | 98.5 /100 | #57 | Exceptional 83.5% |
| Eastern Europeans | 98.5 /100 | #58 | Exceptional 83.5% |
| Bhutanese | 98.3 /100 | #59 | Exceptional 83.5% |
| Carpatho Rusyns | 98.3 /100 | #60 | Exceptional 83.5% |
| Filipinos | 98.3 /100 | #61 | Exceptional 83.5% |
| Immigrants | Taiwan | 98.0 /100 | #62 | Exceptional 83.5% |
| Afghans | 97.9 /100 | #63 | Exceptional 83.5% |
| Immigrants | Kenya | 97.9 /100 | #64 | Exceptional 83.5% |