Chinese vs Immigrants from India No Schooling Completed
COMPARE
Chinese
Immigrants from India
No Schooling Completed
No Schooling Completed Comparison
Chinese
Immigrants from India
1.5%
NO SCHOOLING COMPLETED
100.0/ 100
METRIC RATING
21st/ 347
METRIC RANK
1.7%
NO SCHOOLING COMPLETED
99.4/ 100
METRIC RATING
73rd/ 347
METRIC RANK
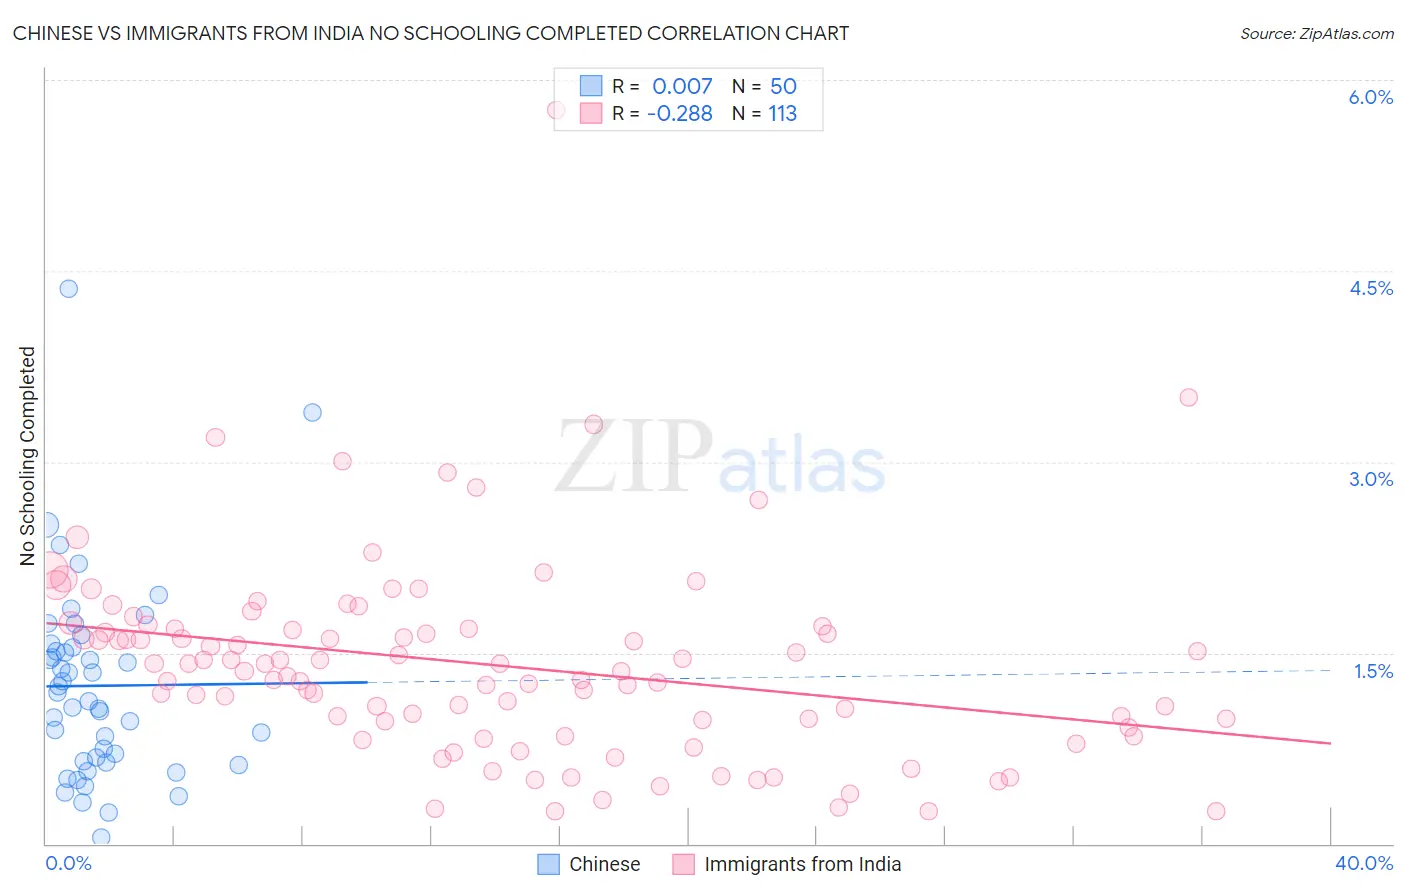
Chinese vs Immigrants from India No Schooling Completed Correlation Chart
The statistical analysis conducted on geographies consisting of 64,531,891 people shows no correlation between the proportion of Chinese and percentage of population with no schooling in the United States with a correlation coefficient (R) of 0.007 and weighted average of 1.5%. Similarly, the statistical analysis conducted on geographies consisting of 429,114,118 people shows a weak negative correlation between the proportion of Immigrants from India and percentage of population with no schooling in the United States with a correlation coefficient (R) of -0.288 and weighted average of 1.7%, a difference of 17.3%.
No Schooling Completed Correlation Summary
| Measurement | Chinese | Immigrants from India |
| Minimum | 0.048% | 0.25% |
| Maximum | 4.4% | 5.8% |
| Range | 4.3% | 5.5% |
| Mean | 1.2% | 1.4% |
| Median | 1.2% | 1.4% |
| Interquartile 25% (IQ1) | 0.65% | 0.94% |
| Interquartile 75% (IQ3) | 1.5% | 1.7% |
| Interquartile Range (IQR) | 0.90% | 0.75% |
| Standard Deviation (Sample) | 0.79% | 0.79% |
| Standard Deviation (Population) | 0.78% | 0.78% |
Similar Demographics by No Schooling Completed
Demographics Similar to Chinese by No Schooling Completed
In terms of no schooling completed, the demographic groups most similar to Chinese are Alaska Native (1.5%, a difference of 0.090%), European (1.5%, a difference of 0.34%), Welsh (1.5%, a difference of 0.37%), Alaskan Athabascan (1.5%, a difference of 0.49%), and Danish (1.5%, a difference of 0.60%).
| Demographics | Rating | Rank | No Schooling Completed |
| Scotch-Irish | 100.0 /100 | #14 | Exceptional 1.5% |
| Tlingit-Haida | 100.0 /100 | #15 | Exceptional 1.5% |
| Finns | 100.0 /100 | #16 | Exceptional 1.5% |
| Croatians | 100.0 /100 | #17 | Exceptional 1.5% |
| Danes | 100.0 /100 | #18 | Exceptional 1.5% |
| Alaskan Athabascans | 100.0 /100 | #19 | Exceptional 1.5% |
| Welsh | 100.0 /100 | #20 | Exceptional 1.5% |
| Chinese | 100.0 /100 | #21 | Exceptional 1.5% |
| Alaska Natives | 100.0 /100 | #22 | Exceptional 1.5% |
| Europeans | 100.0 /100 | #23 | Exceptional 1.5% |
| Pennsylvania Germans | 100.0 /100 | #24 | Exceptional 1.5% |
| French | 100.0 /100 | #25 | Exceptional 1.5% |
| Czechs | 100.0 /100 | #26 | Exceptional 1.5% |
| Scandinavians | 100.0 /100 | #27 | Exceptional 1.5% |
| French Canadians | 100.0 /100 | #28 | Exceptional 1.5% |
Demographics Similar to Immigrants from India by No Schooling Completed
In terms of no schooling completed, the demographic groups most similar to Immigrants from India are Zimbabwean (1.7%, a difference of 0.020%), Cajun (1.7%, a difference of 0.48%), Immigrants from Belgium (1.7%, a difference of 0.60%), Immigrants from England (1.7%, a difference of 0.65%), and Cherokee (1.7%, a difference of 0.65%).
| Demographics | Rating | Rank | No Schooling Completed |
| Canadians | 99.7 /100 | #66 | Exceptional 1.7% |
| Immigrants | Austria | 99.7 /100 | #67 | Exceptional 1.7% |
| Immigrants | Lithuania | 99.7 /100 | #68 | Exceptional 1.7% |
| Chickasaw | 99.6 /100 | #69 | Exceptional 1.7% |
| Immigrants | Netherlands | 99.6 /100 | #70 | Exceptional 1.7% |
| Immigrants | England | 99.5 /100 | #71 | Exceptional 1.7% |
| Cajuns | 99.5 /100 | #72 | Exceptional 1.7% |
| Immigrants | India | 99.4 /100 | #73 | Exceptional 1.7% |
| Zimbabweans | 99.4 /100 | #74 | Exceptional 1.7% |
| Immigrants | Belgium | 99.3 /100 | #75 | Exceptional 1.7% |
| Cherokee | 99.3 /100 | #76 | Exceptional 1.7% |
| Immigrants | Sweden | 99.3 /100 | #77 | Exceptional 1.7% |
| Delaware | 99.3 /100 | #78 | Exceptional 1.7% |
| Macedonians | 99.3 /100 | #79 | Exceptional 1.7% |
| Cypriots | 99.3 /100 | #80 | Exceptional 1.7% |