Chilean vs French American Indian In Labor Force | Age 20-24
COMPARE
Chilean
French American Indian
In Labor Force | Age 20-24
In Labor Force | Age 20-24 Comparison
Chileans
French American Indians
74.5%
IN LABOR FORCE | AGE 20-24
12.5/ 100
METRIC RATING
217th/ 347
METRIC RANK
76.8%
IN LABOR FORCE | AGE 20-24
99.8/ 100
METRIC RATING
68th/ 347
METRIC RANK
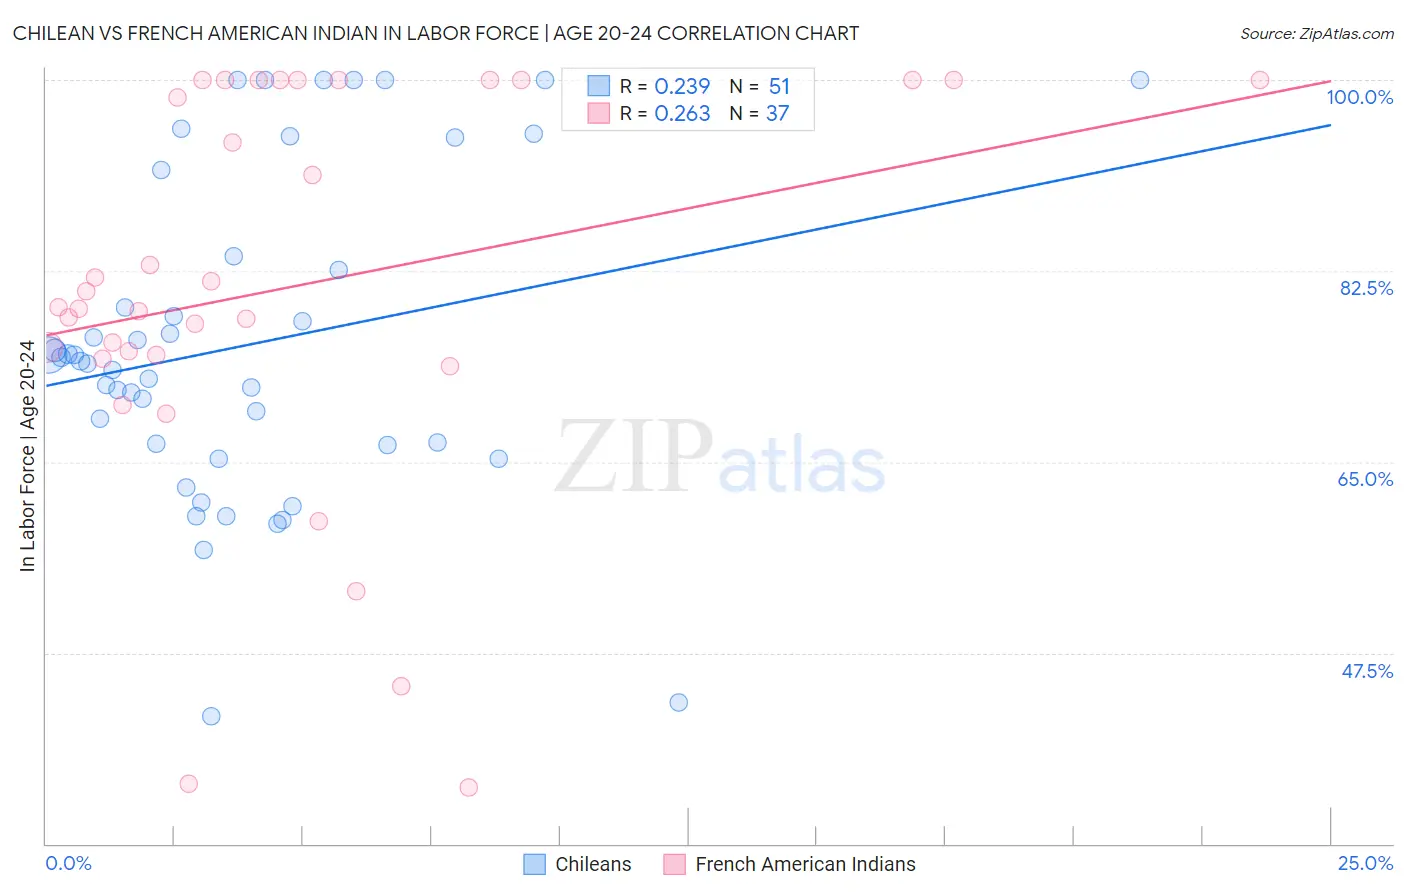
Chilean vs French American Indian In Labor Force | Age 20-24 Correlation Chart
The statistical analysis conducted on geographies consisting of 256,670,531 people shows a weak positive correlation between the proportion of Chileans and labor force participation rate among population between the ages 20 and 24 in the United States with a correlation coefficient (R) of 0.239 and weighted average of 74.5%. Similarly, the statistical analysis conducted on geographies consisting of 131,958,584 people shows a weak positive correlation between the proportion of French American Indians and labor force participation rate among population between the ages 20 and 24 in the United States with a correlation coefficient (R) of 0.263 and weighted average of 76.8%, a difference of 3.1%.
In Labor Force | Age 20-24 Correlation Summary
| Measurement | Chilean | French American Indian |
| Minimum | 41.7% | 35.1% |
| Maximum | 100.0% | 100.0% |
| Range | 58.3% | 64.9% |
| Mean | 75.8% | 81.1% |
| Median | 74.3% | 79.2% |
| Interquartile 25% (IQ1) | 66.6% | 74.6% |
| Interquartile 75% (IQ3) | 83.8% | 100.0% |
| Interquartile Range (IQR) | 17.3% | 25.4% |
| Standard Deviation (Sample) | 14.8% | 18.1% |
| Standard Deviation (Population) | 14.6% | 17.9% |
Similar Demographics by In Labor Force | Age 20-24
Demographics Similar to Chileans by In Labor Force | Age 20-24
In terms of in labor force | age 20-24, the demographic groups most similar to Chileans are Immigrants from Ghana (74.5%, a difference of 0.010%), Immigrants from Kuwait (74.5%, a difference of 0.010%), Immigrants from Southern Europe (74.5%, a difference of 0.020%), Creek (74.5%, a difference of 0.030%), and Peruvian (74.5%, a difference of 0.030%).
| Demographics | Rating | Rank | In Labor Force | Age 20-24 |
| Uruguayans | 15.1 /100 | #210 | Poor 74.6% |
| Immigrants | Australia | 14.7 /100 | #211 | Poor 74.6% |
| Creek | 13.3 /100 | #212 | Poor 74.5% |
| Peruvians | 13.3 /100 | #213 | Poor 74.5% |
| Immigrants | Southern Europe | 13.2 /100 | #214 | Poor 74.5% |
| Immigrants | Ghana | 12.7 /100 | #215 | Poor 74.5% |
| Immigrants | Kuwait | 12.7 /100 | #216 | Poor 74.5% |
| Chileans | 12.5 /100 | #217 | Poor 74.5% |
| Immigrants | Peru | 10.6 /100 | #218 | Poor 74.5% |
| Nepalese | 10.5 /100 | #219 | Poor 74.5% |
| Immigrants | Norway | 10.3 /100 | #220 | Poor 74.5% |
| Chickasaw | 10.3 /100 | #221 | Poor 74.5% |
| Immigrants | India | 9.9 /100 | #222 | Tragic 74.4% |
| Hispanics or Latinos | 7.9 /100 | #223 | Tragic 74.4% |
| Seminole | 6.9 /100 | #224 | Tragic 74.3% |
Demographics Similar to French American Indians by In Labor Force | Age 20-24
In terms of in labor force | age 20-24, the demographic groups most similar to French American Indians are Immigrants from Sudan (76.8%, a difference of 0.020%), Ottawa (76.8%, a difference of 0.030%), Icelander (76.9%, a difference of 0.040%), Slavic (76.9%, a difference of 0.040%), and Crow (76.9%, a difference of 0.060%).
| Demographics | Rating | Rank | In Labor Force | Age 20-24 |
| Immigrants | Eritrea | 99.9 /100 | #61 | Exceptional 77.0% |
| Immigrants | Kenya | 99.9 /100 | #62 | Exceptional 77.0% |
| Lithuanians | 99.9 /100 | #63 | Exceptional 77.0% |
| Whites/Caucasians | 99.9 /100 | #64 | Exceptional 76.9% |
| Crow | 99.9 /100 | #65 | Exceptional 76.9% |
| Icelanders | 99.9 /100 | #66 | Exceptional 76.9% |
| Slavs | 99.9 /100 | #67 | Exceptional 76.9% |
| French American Indians | 99.8 /100 | #68 | Exceptional 76.8% |
| Immigrants | Sudan | 99.8 /100 | #69 | Exceptional 76.8% |
| Ottawa | 99.8 /100 | #70 | Exceptional 76.8% |
| Northern Europeans | 99.8 /100 | #71 | Exceptional 76.8% |
| Guamanians/Chamorros | 99.8 /100 | #72 | Exceptional 76.7% |
| British | 99.8 /100 | #73 | Exceptional 76.7% |
| Cree | 99.7 /100 | #74 | Exceptional 76.6% |
| Immigrants | Middle Africa | 99.7 /100 | #75 | Exceptional 76.6% |