Mexican vs Bolivian In Labor Force | Age 45-54
COMPARE
Mexican
Bolivian
In Labor Force | Age 45-54
In Labor Force | Age 45-54 Comparison
Mexicans
Bolivians
79.8%
IN LABOR FORCE | AGE 45-54
0.0/ 100
METRIC RATING
311th/ 347
METRIC RANK
84.9%
IN LABOR FORCE | AGE 45-54
100.0/ 100
METRIC RATING
3rd/ 347
METRIC RANK
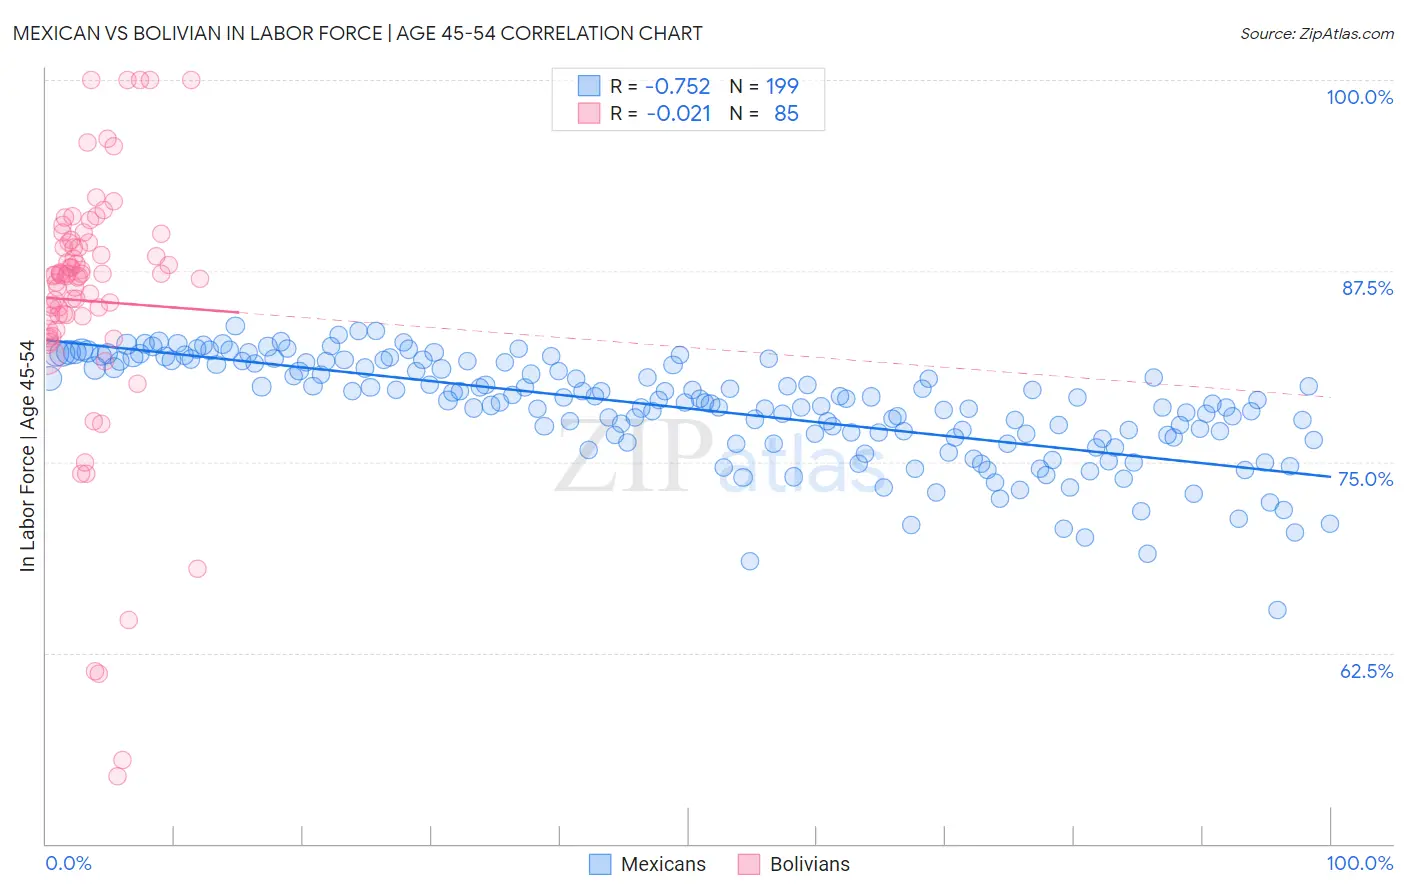
Mexican vs Bolivian In Labor Force | Age 45-54 Correlation Chart
The statistical analysis conducted on geographies consisting of 564,480,863 people shows a strong negative correlation between the proportion of Mexicans and labor force participation rate among population between the ages 45 and 54 in the United States with a correlation coefficient (R) of -0.752 and weighted average of 79.8%. Similarly, the statistical analysis conducted on geographies consisting of 184,622,746 people shows no correlation between the proportion of Bolivians and labor force participation rate among population between the ages 45 and 54 in the United States with a correlation coefficient (R) of -0.021 and weighted average of 84.9%, a difference of 6.4%.
In Labor Force | Age 45-54 Correlation Summary
| Measurement | Mexican | Bolivian |
| Minimum | 65.3% | 54.4% |
| Maximum | 83.9% | 100.0% |
| Range | 18.6% | 45.6% |
| Mean | 78.5% | 85.5% |
| Median | 79.0% | 87.2% |
| Interquartile 25% (IQ1) | 76.6% | 84.1% |
| Interquartile 75% (IQ3) | 81.5% | 89.4% |
| Interquartile Range (IQR) | 4.9% | 5.3% |
| Standard Deviation (Sample) | 3.4% | 8.6% |
| Standard Deviation (Population) | 3.4% | 8.6% |
Similar Demographics by In Labor Force | Age 45-54
Demographics Similar to Mexicans by In Labor Force | Age 45-54
In terms of in labor force | age 45-54, the demographic groups most similar to Mexicans are Inupiat (79.9%, a difference of 0.11%), Immigrants from Mexico (79.7%, a difference of 0.14%), Potawatomi (80.0%, a difference of 0.20%), Central American Indian (80.0%, a difference of 0.22%), and Blackfeet (80.0%, a difference of 0.26%).
| Demographics | Rating | Rank | In Labor Force | Age 45-54 |
| Hispanics or Latinos | 0.0 /100 | #304 | Tragic 80.1% |
| Immigrants | Dominican Republic | 0.0 /100 | #305 | Tragic 80.1% |
| Spanish Americans | 0.0 /100 | #306 | Tragic 80.1% |
| Blackfeet | 0.0 /100 | #307 | Tragic 80.0% |
| Central American Indians | 0.0 /100 | #308 | Tragic 80.0% |
| Potawatomi | 0.0 /100 | #309 | Tragic 80.0% |
| Inupiat | 0.0 /100 | #310 | Tragic 79.9% |
| Mexicans | 0.0 /100 | #311 | Tragic 79.8% |
| Immigrants | Mexico | 0.0 /100 | #312 | Tragic 79.7% |
| Colville | 0.0 /100 | #313 | Tragic 79.5% |
| Ottawa | 0.0 /100 | #314 | Tragic 79.5% |
| Blacks/African Americans | 0.0 /100 | #315 | Tragic 79.3% |
| Shoshone | 0.0 /100 | #316 | Tragic 79.3% |
| Comanche | 0.0 /100 | #317 | Tragic 79.2% |
| Chickasaw | 0.0 /100 | #318 | Tragic 79.0% |
Demographics Similar to Bolivians by In Labor Force | Age 45-54
In terms of in labor force | age 45-54, the demographic groups most similar to Bolivians are Luxembourger (85.0%, a difference of 0.090%), Immigrants from Ethiopia (84.8%, a difference of 0.12%), Ethiopian (84.8%, a difference of 0.20%), Immigrants from India (84.7%, a difference of 0.31%), and Immigrants from Cameroon (84.6%, a difference of 0.38%).
| Demographics | Rating | Rank | In Labor Force | Age 45-54 |
| Immigrants | Bolivia | 100.0 /100 | #1 | Exceptional 85.3% |
| Luxembourgers | 100.0 /100 | #2 | Exceptional 85.0% |
| Bolivians | 100.0 /100 | #3 | Exceptional 84.9% |
| Immigrants | Ethiopia | 100.0 /100 | #4 | Exceptional 84.8% |
| Ethiopians | 100.0 /100 | #5 | Exceptional 84.8% |
| Immigrants | India | 100.0 /100 | #6 | Exceptional 84.7% |
| Immigrants | Cameroon | 100.0 /100 | #7 | Exceptional 84.6% |
| Sierra Leoneans | 100.0 /100 | #8 | Exceptional 84.5% |
| Immigrants | Sierra Leone | 100.0 /100 | #9 | Exceptional 84.4% |
| Norwegians | 100.0 /100 | #10 | Exceptional 84.4% |
| Thais | 100.0 /100 | #11 | Exceptional 84.3% |
| Bulgarians | 100.0 /100 | #12 | Exceptional 84.2% |
| Chinese | 99.9 /100 | #13 | Exceptional 84.1% |
| Cambodians | 99.9 /100 | #14 | Exceptional 84.1% |
| Cypriots | 99.9 /100 | #15 | Exceptional 84.1% |