British West Indian vs Uruguayan 5th Grade
COMPARE
British West Indian
Uruguayan
5th Grade
5th Grade Comparison
British West Indians
Uruguayans
96.5%
5TH GRADE
0.0/ 100
METRIC RATING
290th/ 347
METRIC RANK
97.0%
5TH GRADE
3.2/ 100
METRIC RATING
235th/ 347
METRIC RANK
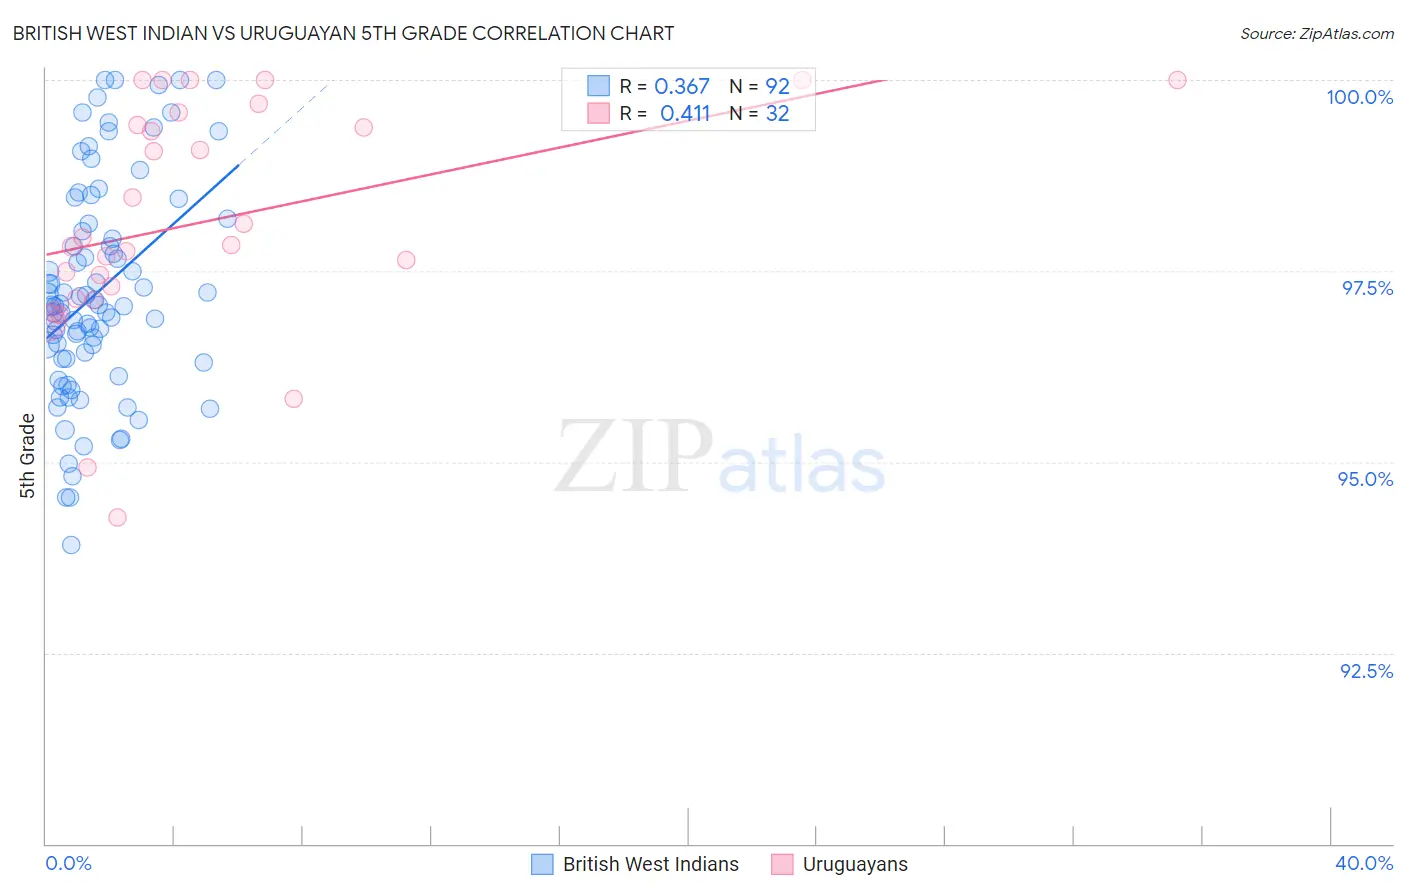
British West Indian vs Uruguayan 5th Grade Correlation Chart
The statistical analysis conducted on geographies consisting of 152,691,173 people shows a mild positive correlation between the proportion of British West Indians and percentage of population with at least 5th grade education in the United States with a correlation coefficient (R) of 0.367 and weighted average of 96.5%. Similarly, the statistical analysis conducted on geographies consisting of 144,782,794 people shows a moderate positive correlation between the proportion of Uruguayans and percentage of population with at least 5th grade education in the United States with a correlation coefficient (R) of 0.411 and weighted average of 97.0%, a difference of 0.53%.
5th Grade Correlation Summary
| Measurement | British West Indian | Uruguayan |
| Minimum | 93.9% | 94.3% |
| Maximum | 100.0% | 100.0% |
| Range | 6.1% | 5.7% |
| Mean | 97.2% | 98.2% |
| Median | 97.0% | 97.9% |
| Interquartile 25% (IQ1) | 96.3% | 97.2% |
| Interquartile 75% (IQ3) | 98.1% | 99.5% |
| Interquartile Range (IQR) | 1.7% | 2.3% |
| Standard Deviation (Sample) | 1.4% | 1.5% |
| Standard Deviation (Population) | 1.4% | 1.5% |
Similar Demographics by 5th Grade
Demographics Similar to British West Indians by 5th Grade
In terms of 5th grade, the demographic groups most similar to British West Indians are Malaysian (96.5%, a difference of 0.0%), Somali (96.5%, a difference of 0.010%), Immigrants from West Indies (96.5%, a difference of 0.020%), Immigrants from Grenada (96.5%, a difference of 0.020%), and Immigrants from Eritrea (96.4%, a difference of 0.060%).
| Demographics | Rating | Rank | 5th Grade |
| Fijians | 0.1 /100 | #283 | Tragic 96.6% |
| Immigrants | Trinidad and Tobago | 0.1 /100 | #284 | Tragic 96.6% |
| Immigrants | St. Vincent and the Grenadines | 0.1 /100 | #285 | Tragic 96.6% |
| Immigrants | Thailand | 0.1 /100 | #286 | Tragic 96.6% |
| Immigrants | Afghanistan | 0.1 /100 | #287 | Tragic 96.6% |
| Immigrants | Barbados | 0.0 /100 | #288 | Tragic 96.6% |
| Immigrants | West Indies | 0.0 /100 | #289 | Tragic 96.5% |
| British West Indians | 0.0 /100 | #290 | Tragic 96.5% |
| Malaysians | 0.0 /100 | #291 | Tragic 96.5% |
| Somalis | 0.0 /100 | #292 | Tragic 96.5% |
| Immigrants | Grenada | 0.0 /100 | #293 | Tragic 96.5% |
| Immigrants | Eritrea | 0.0 /100 | #294 | Tragic 96.4% |
| Immigrants | Somalia | 0.0 /100 | #295 | Tragic 96.4% |
| Immigrants | South Eastern Asia | 0.0 /100 | #296 | Tragic 96.3% |
| Haitians | 0.0 /100 | #297 | Tragic 96.3% |
Demographics Similar to Uruguayans by 5th Grade
In terms of 5th grade, the demographic groups most similar to Uruguayans are Subsaharan African (97.0%, a difference of 0.0%), Tohono O'odham (97.0%, a difference of 0.0%), Immigrants from Eastern Asia (97.0%, a difference of 0.020%), Senegalese (97.0%, a difference of 0.020%), and Immigrants from Western Asia (97.0%, a difference of 0.030%).
| Demographics | Rating | Rank | 5th Grade |
| Assyrians/Chaldeans/Syriacs | 4.5 /100 | #228 | Tragic 97.0% |
| Yuman | 4.5 /100 | #229 | Tragic 97.0% |
| Immigrants | Western Asia | 4.3 /100 | #230 | Tragic 97.0% |
| Immigrants | Malaysia | 4.1 /100 | #231 | Tragic 97.0% |
| Immigrants | Eastern Asia | 4.0 /100 | #232 | Tragic 97.0% |
| Sub-Saharan Africans | 3.3 /100 | #233 | Tragic 97.0% |
| Tohono O'odham | 3.2 /100 | #234 | Tragic 97.0% |
| Uruguayans | 3.2 /100 | #235 | Tragic 97.0% |
| Senegalese | 2.8 /100 | #236 | Tragic 97.0% |
| Immigrants | Indonesia | 2.0 /100 | #237 | Tragic 96.9% |
| Asians | 2.0 /100 | #238 | Tragic 96.9% |
| Nigerians | 1.9 /100 | #239 | Tragic 96.9% |
| Indians (Asian) | 1.9 /100 | #240 | Tragic 96.9% |
| Immigrants | Asia | 1.7 /100 | #241 | Tragic 96.9% |
| Immigrants | Costa Rica | 1.6 /100 | #242 | Tragic 96.9% |