Belizean vs Immigrants from Spain 4th Grade
COMPARE
Belizean
Immigrants from Spain
4th Grade
4th Grade Comparison
Belizeans
Immigrants from Spain
96.1%
4TH GRADE
0.0/ 100
METRIC RATING
319th/ 347
METRIC RANK
97.5%
4TH GRADE
51.8/ 100
METRIC RATING
170th/ 347
METRIC RANK
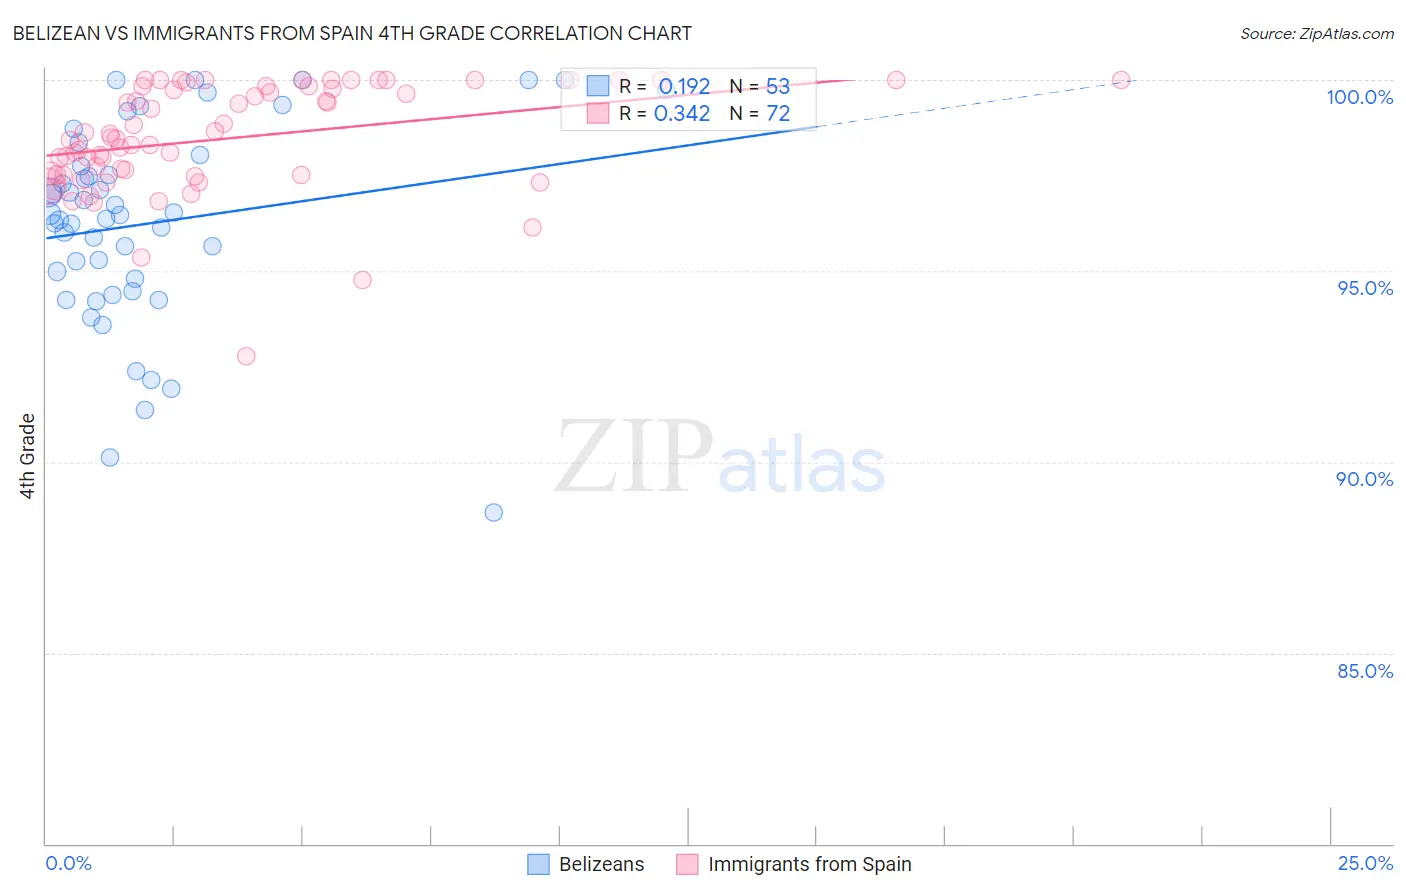
Belizean vs Immigrants from Spain 4th Grade Correlation Chart
The statistical analysis conducted on geographies consisting of 144,224,236 people shows a poor positive correlation between the proportion of Belizeans and percentage of population with at least 4th grade education in the United States with a correlation coefficient (R) of 0.192 and weighted average of 96.1%. Similarly, the statistical analysis conducted on geographies consisting of 239,682,725 people shows a mild positive correlation between the proportion of Immigrants from Spain and percentage of population with at least 4th grade education in the United States with a correlation coefficient (R) of 0.342 and weighted average of 97.5%, a difference of 1.5%.
4th Grade Correlation Summary
| Measurement | Belizean | Immigrants from Spain |
| Minimum | 88.7% | 92.8% |
| Maximum | 100.0% | 100.0% |
| Range | 11.3% | 7.2% |
| Mean | 96.3% | 98.5% |
| Median | 96.5% | 98.5% |
| Interquartile 25% (IQ1) | 94.6% | 97.5% |
| Interquartile 75% (IQ3) | 97.9% | 99.8% |
| Interquartile Range (IQR) | 3.3% | 2.3% |
| Standard Deviation (Sample) | 2.6% | 1.4% |
| Standard Deviation (Population) | 2.6% | 1.4% |
Similar Demographics by 4th Grade
Demographics Similar to Belizeans by 4th Grade
In terms of 4th grade, the demographic groups most similar to Belizeans are Bangladeshi (96.1%, a difference of 0.010%), Immigrants from the Azores (96.1%, a difference of 0.020%), Central American Indian (96.2%, a difference of 0.060%), Immigrants from Ecuador (96.2%, a difference of 0.10%), and Japanese (96.0%, a difference of 0.10%).
| Demographics | Rating | Rank | 4th Grade |
| Cape Verdeans | 0.0 /100 | #312 | Tragic 96.2% |
| Indonesians | 0.0 /100 | #313 | Tragic 96.2% |
| Vietnamese | 0.0 /100 | #314 | Tragic 96.2% |
| Nicaraguans | 0.0 /100 | #315 | Tragic 96.2% |
| Immigrants | Ecuador | 0.0 /100 | #316 | Tragic 96.2% |
| Central American Indians | 0.0 /100 | #317 | Tragic 96.2% |
| Immigrants | Azores | 0.0 /100 | #318 | Tragic 96.1% |
| Belizeans | 0.0 /100 | #319 | Tragic 96.1% |
| Bangladeshis | 0.0 /100 | #320 | Tragic 96.1% |
| Japanese | 0.0 /100 | #321 | Tragic 96.0% |
| Immigrants | Vietnam | 0.0 /100 | #322 | Tragic 96.0% |
| Immigrants | Nicaragua | 0.0 /100 | #323 | Tragic 96.0% |
| Immigrants | Belize | 0.0 /100 | #324 | Tragic 96.0% |
| Dominicans | 0.0 /100 | #325 | Tragic 96.0% |
| Hispanics or Latinos | 0.0 /100 | #326 | Tragic 96.0% |
Demographics Similar to Immigrants from Spain by 4th Grade
In terms of 4th grade, the demographic groups most similar to Immigrants from Spain are Brazilian (97.5%, a difference of 0.0%), Immigrants from Sri Lanka (97.5%, a difference of 0.0%), Immigrants from Korea (97.5%, a difference of 0.0%), Chilean (97.5%, a difference of 0.010%), and Egyptian (97.5%, a difference of 0.010%).
| Demographics | Rating | Rank | 4th Grade |
| Immigrants | Iran | 60.3 /100 | #163 | Good 97.6% |
| Ugandans | 58.9 /100 | #164 | Average 97.6% |
| Venezuelans | 58.7 /100 | #165 | Average 97.6% |
| Kenyans | 56.5 /100 | #166 | Average 97.5% |
| Immigrants | Poland | 55.9 /100 | #167 | Average 97.5% |
| Immigrants | Belarus | 55.8 /100 | #168 | Average 97.5% |
| Chileans | 54.4 /100 | #169 | Average 97.5% |
| Immigrants | Spain | 51.8 /100 | #170 | Average 97.5% |
| Brazilians | 51.5 /100 | #171 | Average 97.5% |
| Immigrants | Sri Lanka | 51.1 /100 | #172 | Average 97.5% |
| Immigrants | Korea | 50.6 /100 | #173 | Average 97.5% |
| Egyptians | 50.0 /100 | #174 | Average 97.5% |
| Immigrants | Micronesia | 49.6 /100 | #175 | Average 97.5% |
| Arabs | 48.7 /100 | #176 | Average 97.5% |
| Immigrants | Brazil | 46.1 /100 | #177 | Average 97.5% |