Barbadian vs French Canadian In Labor Force | Age 30-34
COMPARE
Barbadian
French Canadian
In Labor Force | Age 30-34
In Labor Force | Age 30-34 Comparison
Barbadians
French Canadians
84.6%
IN LABOR FORCE | AGE 30-34
36.7/ 100
METRIC RATING
182nd/ 347
METRIC RANK
84.8%
IN LABOR FORCE | AGE 30-34
67.3/ 100
METRIC RATING
156th/ 347
METRIC RANK
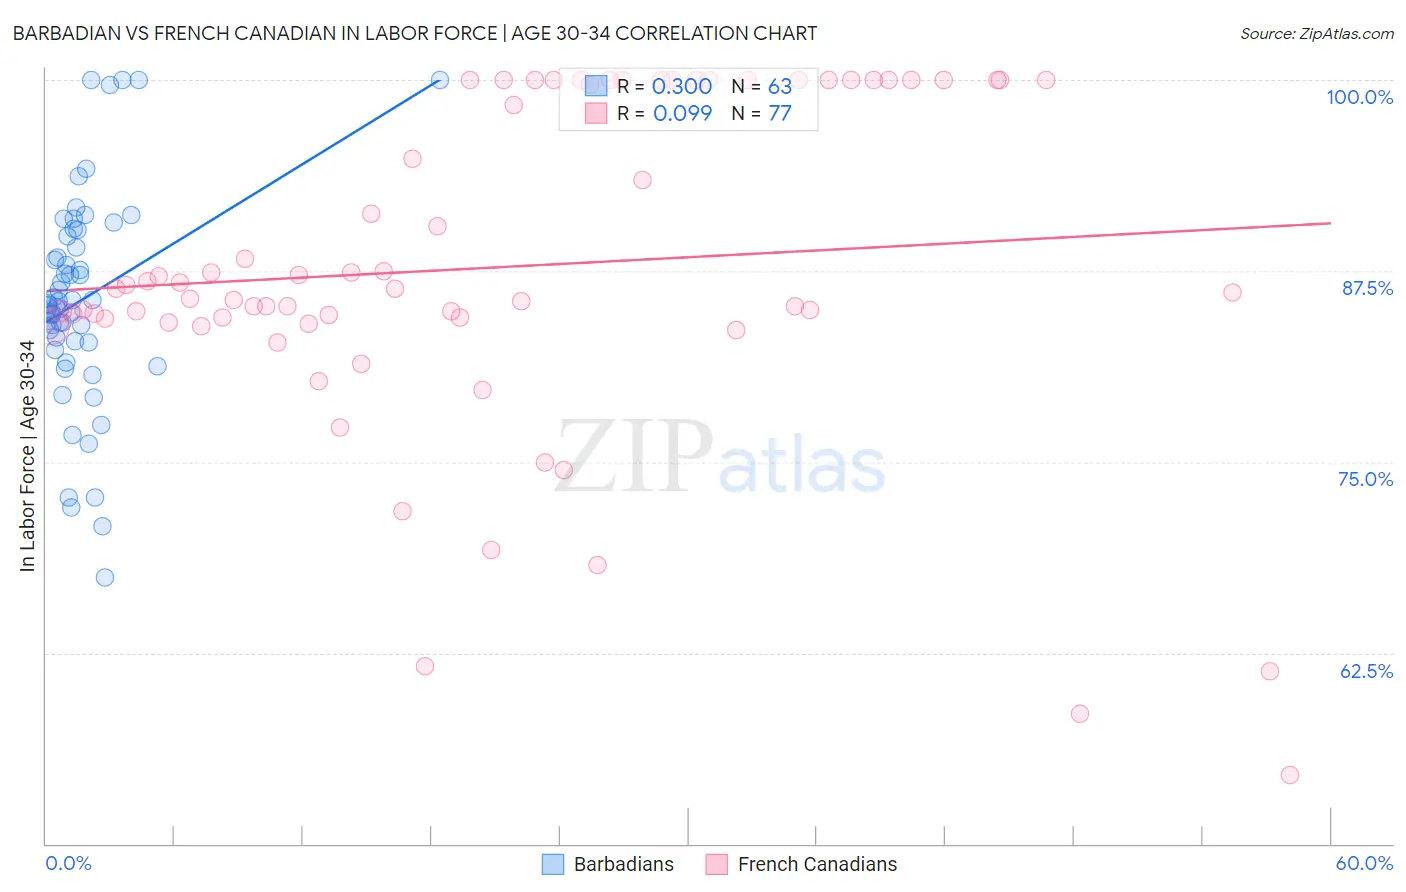
Barbadian vs French Canadian In Labor Force | Age 30-34 Correlation Chart
The statistical analysis conducted on geographies consisting of 141,265,054 people shows a weak positive correlation between the proportion of Barbadians and labor force participation rate among population between the ages 30 and 34 in the United States with a correlation coefficient (R) of 0.300 and weighted average of 84.6%. Similarly, the statistical analysis conducted on geographies consisting of 502,030,887 people shows a slight positive correlation between the proportion of French Canadians and labor force participation rate among population between the ages 30 and 34 in the United States with a correlation coefficient (R) of 0.099 and weighted average of 84.8%, a difference of 0.22%.
In Labor Force | Age 30-34 Correlation Summary
| Measurement | Barbadian | French Canadian |
| Minimum | 67.5% | 54.5% |
| Maximum | 100.0% | 100.0% |
| Range | 32.5% | 45.5% |
| Mean | 85.6% | 87.8% |
| Median | 85.3% | 86.3% |
| Interquartile 25% (IQ1) | 82.8% | 84.2% |
| Interquartile 75% (IQ3) | 89.7% | 100.0% |
| Interquartile Range (IQR) | 6.9% | 15.8% |
| Standard Deviation (Sample) | 6.9% | 10.8% |
| Standard Deviation (Population) | 6.9% | 10.7% |
Similar Demographics by In Labor Force | Age 30-34
Demographics Similar to Barbadians by In Labor Force | Age 30-34
In terms of in labor force | age 30-34, the demographic groups most similar to Barbadians are Immigrants from Canada (84.6%, a difference of 0.010%), Moroccan (84.6%, a difference of 0.030%), Immigrants from North America (84.6%, a difference of 0.030%), Immigrants from Nigeria (84.6%, a difference of 0.040%), and Immigrants from Netherlands (84.6%, a difference of 0.040%).
| Demographics | Rating | Rank | In Labor Force | Age 30-34 |
| Immigrants | South America | 50.0 /100 | #175 | Average 84.7% |
| Immigrants | Uzbekistan | 49.1 /100 | #176 | Average 84.7% |
| Laotians | 46.9 /100 | #177 | Average 84.7% |
| Okinawans | 44.1 /100 | #178 | Average 84.6% |
| Immigrants | Nigeria | 42.5 /100 | #179 | Average 84.6% |
| Immigrants | Netherlands | 42.1 /100 | #180 | Average 84.6% |
| Moroccans | 40.3 /100 | #181 | Average 84.6% |
| Barbadians | 36.7 /100 | #182 | Fair 84.6% |
| Immigrants | Canada | 35.0 /100 | #183 | Fair 84.6% |
| Immigrants | North America | 33.3 /100 | #184 | Fair 84.6% |
| Immigrants | Philippines | 31.5 /100 | #185 | Fair 84.6% |
| Immigrants | Congo | 29.7 /100 | #186 | Fair 84.6% |
| Costa Ricans | 29.6 /100 | #187 | Fair 84.6% |
| Taiwanese | 29.4 /100 | #188 | Fair 84.6% |
| Nigerians | 28.9 /100 | #189 | Fair 84.5% |
Demographics Similar to French Canadians by In Labor Force | Age 30-34
In terms of in labor force | age 30-34, the demographic groups most similar to French Canadians are Peruvian (84.8%, a difference of 0.010%), Syrian (84.8%, a difference of 0.020%), Northern European (84.8%, a difference of 0.020%), Immigrants from Sudan (84.8%, a difference of 0.020%), and Immigrants from Armenia (84.8%, a difference of 0.020%).
| Demographics | Rating | Rank | In Labor Force | Age 30-34 |
| Immigrants | Ukraine | 75.1 /100 | #149 | Good 84.8% |
| Germans | 75.1 /100 | #150 | Good 84.8% |
| Immigrants | Senegal | 74.0 /100 | #151 | Good 84.8% |
| Romanians | 73.5 /100 | #152 | Good 84.8% |
| Syrians | 70.1 /100 | #153 | Good 84.8% |
| Northern Europeans | 70.0 /100 | #154 | Good 84.8% |
| Immigrants | Sudan | 69.5 /100 | #155 | Good 84.8% |
| French Canadians | 67.3 /100 | #156 | Good 84.8% |
| Peruvians | 65.9 /100 | #157 | Good 84.8% |
| Immigrants | Armenia | 64.7 /100 | #158 | Good 84.8% |
| Czechoslovakians | 63.0 /100 | #159 | Good 84.8% |
| Pakistanis | 60.8 /100 | #160 | Good 84.7% |
| Immigrants | Cambodia | 60.7 /100 | #161 | Good 84.7% |
| South Americans | 58.7 /100 | #162 | Average 84.7% |
| Immigrants | Uruguay | 57.4 /100 | #163 | Average 84.7% |