Colombian vs Immigrants from Eritrea In Labor Force | Age 45-54
COMPARE
Colombian
Immigrants from Eritrea
In Labor Force | Age 45-54
In Labor Force | Age 45-54 Comparison
Colombians
Immigrants from Eritrea
83.4%
IN LABOR FORCE | AGE 45-54
97.3/ 100
METRIC RATING
71st/ 347
METRIC RANK
83.8%
IN LABOR FORCE | AGE 45-54
99.7/ 100
METRIC RATING
31st/ 347
METRIC RANK
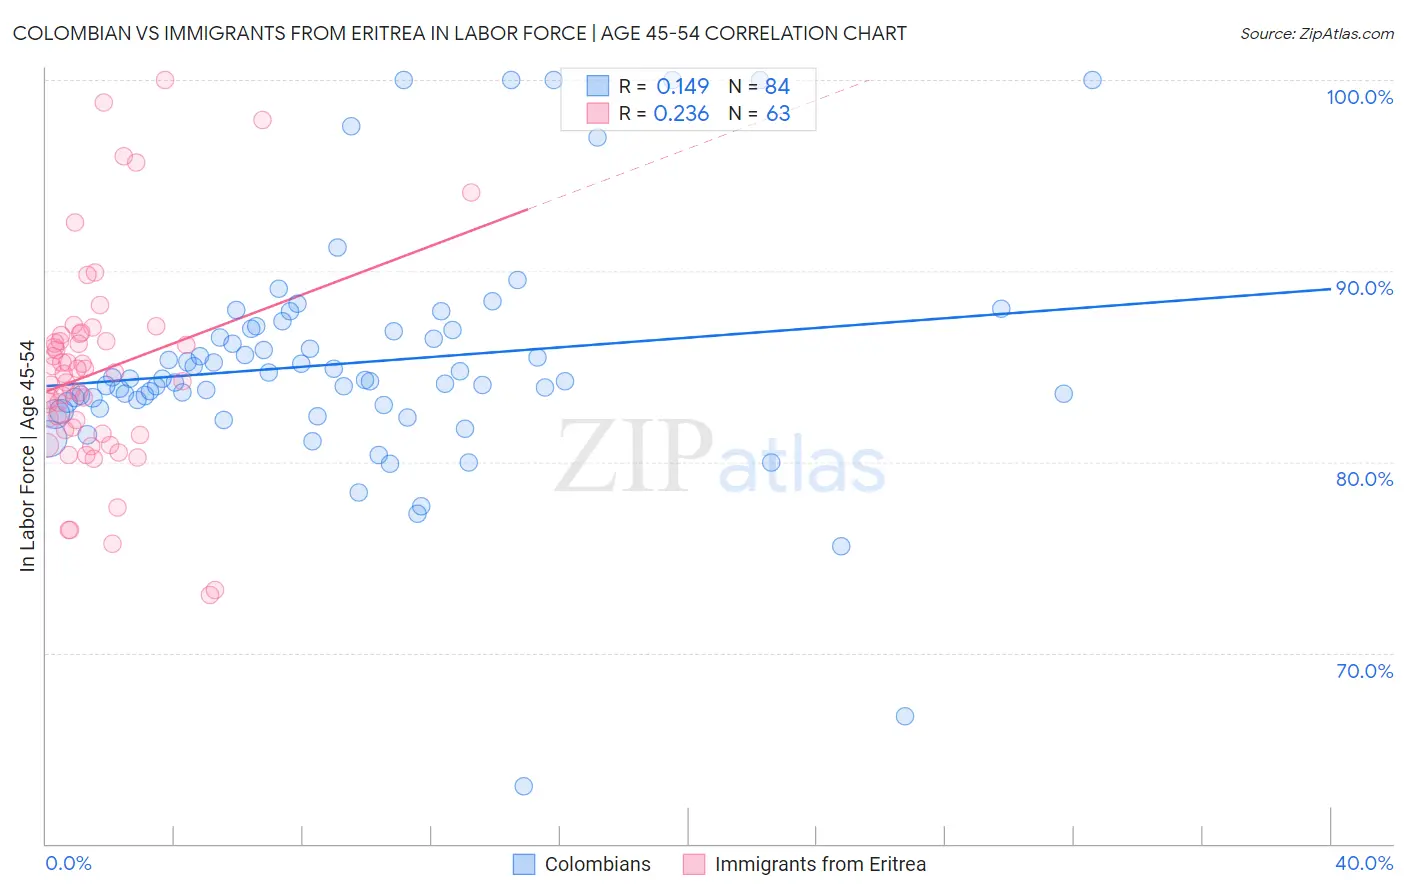
Colombian vs Immigrants from Eritrea In Labor Force | Age 45-54 Correlation Chart
The statistical analysis conducted on geographies consisting of 419,305,643 people shows a poor positive correlation between the proportion of Colombians and labor force participation rate among population between the ages 45 and 54 in the United States with a correlation coefficient (R) of 0.149 and weighted average of 83.4%. Similarly, the statistical analysis conducted on geographies consisting of 104,844,448 people shows a weak positive correlation between the proportion of Immigrants from Eritrea and labor force participation rate among population between the ages 45 and 54 in the United States with a correlation coefficient (R) of 0.236 and weighted average of 83.8%, a difference of 0.47%.
In Labor Force | Age 45-54 Correlation Summary
| Measurement | Colombian | Immigrants from Eritrea |
| Minimum | 63.0% | 73.0% |
| Maximum | 100.0% | 100.0% |
| Range | 37.0% | 27.0% |
| Mean | 85.2% | 84.7% |
| Median | 84.3% | 84.6% |
| Interquartile 25% (IQ1) | 83.0% | 81.5% |
| Interquartile 75% (IQ3) | 86.9% | 86.7% |
| Interquartile Range (IQR) | 3.9% | 5.2% |
| Standard Deviation (Sample) | 6.1% | 5.5% |
| Standard Deviation (Population) | 6.1% | 5.4% |
Similar Demographics by In Labor Force | Age 45-54
Demographics Similar to Colombians by In Labor Force | Age 45-54
In terms of in labor force | age 45-54, the demographic groups most similar to Colombians are Immigrants from Latvia (83.4%, a difference of 0.0%), Taiwanese (83.4%, a difference of 0.010%), Immigrants from Colombia (83.4%, a difference of 0.020%), Serbian (83.4%, a difference of 0.020%), and Immigrants from Czechoslovakia (83.4%, a difference of 0.020%).
| Demographics | Rating | Rank | In Labor Force | Age 45-54 |
| Immigrants | Kenya | 97.9 /100 | #64 | Exceptional 83.5% |
| Egyptians | 97.9 /100 | #65 | Exceptional 83.5% |
| Asians | 97.7 /100 | #66 | Exceptional 83.4% |
| Chileans | 97.7 /100 | #67 | Exceptional 83.4% |
| Immigrants | Colombia | 97.6 /100 | #68 | Exceptional 83.4% |
| Taiwanese | 97.5 /100 | #69 | Exceptional 83.4% |
| Immigrants | Latvia | 97.4 /100 | #70 | Exceptional 83.4% |
| Colombians | 97.3 /100 | #71 | Exceptional 83.4% |
| Serbians | 97.2 /100 | #72 | Exceptional 83.4% |
| Immigrants | Czechoslovakia | 97.1 /100 | #73 | Exceptional 83.4% |
| Immigrants | Somalia | 96.9 /100 | #74 | Exceptional 83.4% |
| Estonians | 96.9 /100 | #75 | Exceptional 83.4% |
| Russians | 96.8 /100 | #76 | Exceptional 83.4% |
| Cubans | 96.7 /100 | #77 | Exceptional 83.4% |
| Immigrants | Egypt | 96.6 /100 | #78 | Exceptional 83.4% |
Demographics Similar to Immigrants from Eritrea by In Labor Force | Age 45-54
In terms of in labor force | age 45-54, the demographic groups most similar to Immigrants from Eritrea are Immigrants from Bulgaria (83.8%, a difference of 0.020%), Turkish (83.8%, a difference of 0.020%), Latvian (83.8%, a difference of 0.020%), Immigrants from Pakistan (83.8%, a difference of 0.050%), and Immigrants from Lithuania (83.9%, a difference of 0.070%).
| Demographics | Rating | Rank | In Labor Force | Age 45-54 |
| Slovenes | 99.8 /100 | #24 | Exceptional 83.9% |
| Immigrants | North Macedonia | 99.8 /100 | #25 | Exceptional 83.9% |
| Immigrants | Serbia | 99.8 /100 | #26 | Exceptional 83.9% |
| Immigrants | Brazil | 99.8 /100 | #27 | Exceptional 83.9% |
| Immigrants | Lithuania | 99.8 /100 | #28 | Exceptional 83.9% |
| Immigrants | Pakistan | 99.7 /100 | #29 | Exceptional 83.8% |
| Immigrants | Bulgaria | 99.7 /100 | #30 | Exceptional 83.8% |
| Immigrants | Eritrea | 99.7 /100 | #31 | Exceptional 83.8% |
| Turks | 99.7 /100 | #32 | Exceptional 83.8% |
| Latvians | 99.7 /100 | #33 | Exceptional 83.8% |
| Kenyans | 99.5 /100 | #34 | Exceptional 83.7% |
| Brazilians | 99.5 /100 | #35 | Exceptional 83.7% |
| Ugandans | 99.5 /100 | #36 | Exceptional 83.7% |
| Swedes | 99.4 /100 | #37 | Exceptional 83.7% |
| Immigrants | Venezuela | 99.4 /100 | #38 | Exceptional 83.7% |