Immigrants from Western Europe vs Immigrants from Colombia In Labor Force | Age 45-54

COMPARE

Immigrants from Western Europe
Race
Ancestry
AfghanAfricanAlaska NativeAlaskan AthabascanAlbanianAleutAlsatianAmericanApacheArabArapahoArgentineanArmenianAssyrian/Chaldean/SyriacAustralianAustrianBahamianBangladeshiBarbadianBasqueBelgianBelizeanBermudanBhutaneseBlackfeetBolivianBrazilianBritishBritish West IndianBulgarianBurmeseCajunCambodianCanadianCape VerdeanCarpatho RusynCelticCentral AmericanCentral American IndianCherokeeCheyenneChickasawChileanChineseChippewaChoctawColombianColvilleComancheCosta RicanCreeCreekCroatianCrowCubanCypriotCzechCzechoslovakianDanishDelawareDominicanDutchDutch West IndianEastern EuropeanEcuadorianEgyptianEnglishEstonianEthiopianEuropeanFijianFilipinoFinnishFrenchFrench American IndianFrench CanadianGermanGerman RussianGhanaianGreekGuamanian/ChamorroGuatemalanGuyaneseHaitianHmongHonduranHopiHoumaHungarianIcelanderIndian (Asian)IndonesianInupiatIranianIraqiIrishIroquoisIsraeliItalianJamaicanJapaneseJordanianKenyanKiowaKoreanLaotianLatvianLebaneseLiberianLithuanianLumbeeLuxembourgerMacedonianMalaysianMalteseMarshalleseMenomineeMexicanMexican American IndianMongolianMoroccanNative HawaiianNavajoNepaleseNew ZealanderNicaraguanNigerianNorthern EuropeanNorwegianOkinawanOsageOttawaPaiutePakistaniPalestinianPanamanianParaguayanPennsylvania GermanPeruvianPimaPolishPortuguesePotawatomiPuebloPuerto RicanPuget Sound SalishRomanianRussianSalvadoranSamoanScandinavianScotch-IrishScottishSeminoleSenegaleseSerbianShoshoneSierra LeoneanSiouxSlavicSlovakSloveneSomaliSouth AfricanSouth AmericanSouth American IndianSoviet UnionSpaniardSpanishSpanish AmericanSpanish American IndianSri LankanSubsaharan AfricanSudaneseSwedishSwissSyrianTaiwaneseThaiTlingit-HaidaTohono O'OdhamTonganTrinidadian and TobagonianTsimshianTurkishU.S. Virgin IslanderUgandanUkrainianUruguayanUteVenezuelanVietnameseWelshWest IndianYakamaYaquiYugoslavianYumanYup'ikZimbabwean
Immigration
NonimmigrantsImmigrantsAfghanistanAfricaAlbaniaArgentinaArmeniaAsiaAustraliaAustriaBahamasBangladeshBarbadosBelarusBelgiumBelizeBoliviaBosnia and HerzegovinaBrazilBulgariaBurma/MyanmarCabo VerdeCambodiaCameroonCanadaCaribbeanCentral AmericaChileChinaCongoCosta RicaCroatiaCubaCzechoslovakiaDenmarkDominicaDominican RepublicEastern AfricaEastern AsiaEastern EuropeEcuadorEgyptEl SalvadorEnglandEritreaEthiopiaEuropeFijiFranceGermanyGhanaGreeceGrenadaGuatemalaGuyanaHaitiHondurasHong KongHungaryIndiaIndonesiaIranIraqIrelandIsraelItalyJamaicaJapanJordanKazakhstanKenyaKoreaKuwaitLaosLatin AmericaLatviaLebanonLiberiaLithuaniaMalaysiaMexicoMicronesiaMiddle AfricaMoldovaMoroccoNepalNetherlandsNicaraguaNigeriaNorth AmericaNorth MacedoniaNorthern AfricaNorthern EuropeNorwayOceaniaPakistanPanamaPeruPhilippinesPolandPortugalRomaniaRussiaSaudi ArabiaScotlandSenegalSerbiaSierra LeoneSingaporeSomaliaSouth AfricaSouth AmericaSouth Central AsiaSouth Eastern AsiaSouthern EuropeSpainSri LankaSt. Vincent and the GrenadinesSudanSwedenSwitzerlandSyriaTaiwanThailandTrinidad and TobagoTurkeyUgandaUkraineUruguayUzbekistanVenezuelaVietnamWest IndiesWestern AfricaWestern AsiaWestern EuropeYemenZaireZimbabweAzores
Immigrants from Colombia
Race
Ancestry
AfghanAfricanAlaska NativeAlaskan AthabascanAlbanianAleutAlsatianAmericanApacheArabArapahoArgentineanArmenianAssyrian/Chaldean/SyriacAustralianAustrianBahamianBangladeshiBarbadianBasqueBelgianBelizeanBermudanBhutaneseBlackfeetBolivianBrazilianBritishBritish West IndianBulgarianBurmeseCajunCambodianCanadianCape VerdeanCarpatho RusynCelticCentral AmericanCentral American IndianCherokeeCheyenneChickasawChileanChineseChippewaChoctawColombianColvilleComancheCosta RicanCreeCreekCroatianCrowCubanCypriotCzechCzechoslovakianDanishDelawareDominicanDutchDutch West IndianEastern EuropeanEcuadorianEgyptianEnglishEstonianEthiopianEuropeanFijianFilipinoFinnishFrenchFrench American IndianFrench CanadianGermanGerman RussianGhanaianGreekGuamanian/ChamorroGuatemalanGuyaneseHaitianHmongHonduranHopiHoumaHungarianIcelanderIndian (Asian)IndonesianInupiatIranianIraqiIrishIroquoisIsraeliItalianJamaicanJapaneseJordanianKenyanKiowaKoreanLaotianLatvianLebaneseLiberianLithuanianLumbeeLuxembourgerMacedonianMalaysianMalteseMarshalleseMenomineeMexicanMexican American IndianMongolianMoroccanNative HawaiianNavajoNepaleseNew ZealanderNicaraguanNigerianNorthern EuropeanNorwegianOkinawanOsageOttawaPaiutePakistaniPalestinianPanamanianParaguayanPennsylvania GermanPeruvianPimaPolishPortuguesePotawatomiPuebloPuerto RicanPuget Sound SalishRomanianRussianSalvadoranSamoanScandinavianScotch-IrishScottishSeminoleSenegaleseSerbianShoshoneSierra LeoneanSiouxSlavicSlovakSloveneSomaliSouth AfricanSouth AmericanSouth American IndianSoviet UnionSpaniardSpanishSpanish AmericanSpanish American IndianSri LankanSubsaharan AfricanSudaneseSwedishSwissSyrianTaiwaneseThaiTlingit-HaidaTohono O'OdhamTonganTrinidadian and TobagonianTsimshianTurkishU.S. Virgin IslanderUgandanUkrainianUruguayanUteVenezuelanVietnameseWelshWest IndianYakamaYaquiYugoslavianYumanYup'ikZimbabwean
Immigration
NonimmigrantsImmigrantsAfghanistanAfricaAlbaniaArgentinaArmeniaAsiaAustraliaAustriaBahamasBangladeshBarbadosBelarusBelgiumBelizeBoliviaBosnia and HerzegovinaBrazilBulgariaBurma/MyanmarCabo VerdeCambodiaCameroonCanadaCaribbeanCentral AmericaChileChinaColombiaCongoCosta RicaCroatiaCubaCzechoslovakiaDenmarkDominicaDominican RepublicEastern AfricaEastern AsiaEastern EuropeEcuadorEgyptEl SalvadorEnglandEritreaEthiopiaEuropeFijiFranceGermanyGhanaGreeceGrenadaGuatemalaGuyanaHaitiHondurasHong KongHungaryIndiaIndonesiaIranIraqIrelandIsraelItalyJamaicaJapanJordanKazakhstanKenyaKoreaKuwaitLaosLatin AmericaLatviaLebanonLiberiaLithuaniaMalaysiaMexicoMicronesiaMiddle AfricaMoldovaMoroccoNepalNetherlandsNicaraguaNigeriaNorth AmericaNorth MacedoniaNorthern AfricaNorthern EuropeNorwayOceaniaPakistanPanamaPeruPhilippinesPolandPortugalRomaniaRussiaSaudi ArabiaScotlandSenegalSerbiaSierra LeoneSingaporeSomaliaSouth AfricaSouth AmericaSouth Central AsiaSouth Eastern AsiaSouthern EuropeSpainSri LankaSt. Vincent and the GrenadinesSudanSwedenSwitzerlandSyriaTaiwanThailandTrinidad and TobagoTurkeyUgandaUkraineUruguayUzbekistanVenezuelaVietnamWest IndiesWestern AfricaWestern AsiaYemenZaireZimbabweAzores
In Labor Force | Age 45-54
Income
Poverty
Unemployment
Labor Participation
Family Structure
Vehicle Availability
Education Level
Disability

In Labor Force | Age 45-54 Comparison

Immigrants from Western Europe

Immigrants from Colombia

Poor
Exceptional
82.4%
IN LABOR FORCE | AGE 45-54
10.9/ 100
METRIC RATING
204th/ 347
METRIC RANK
83.4%
IN LABOR FORCE | AGE 45-54
97.6/ 100
METRIC RATING
68th/ 347
METRIC RANK

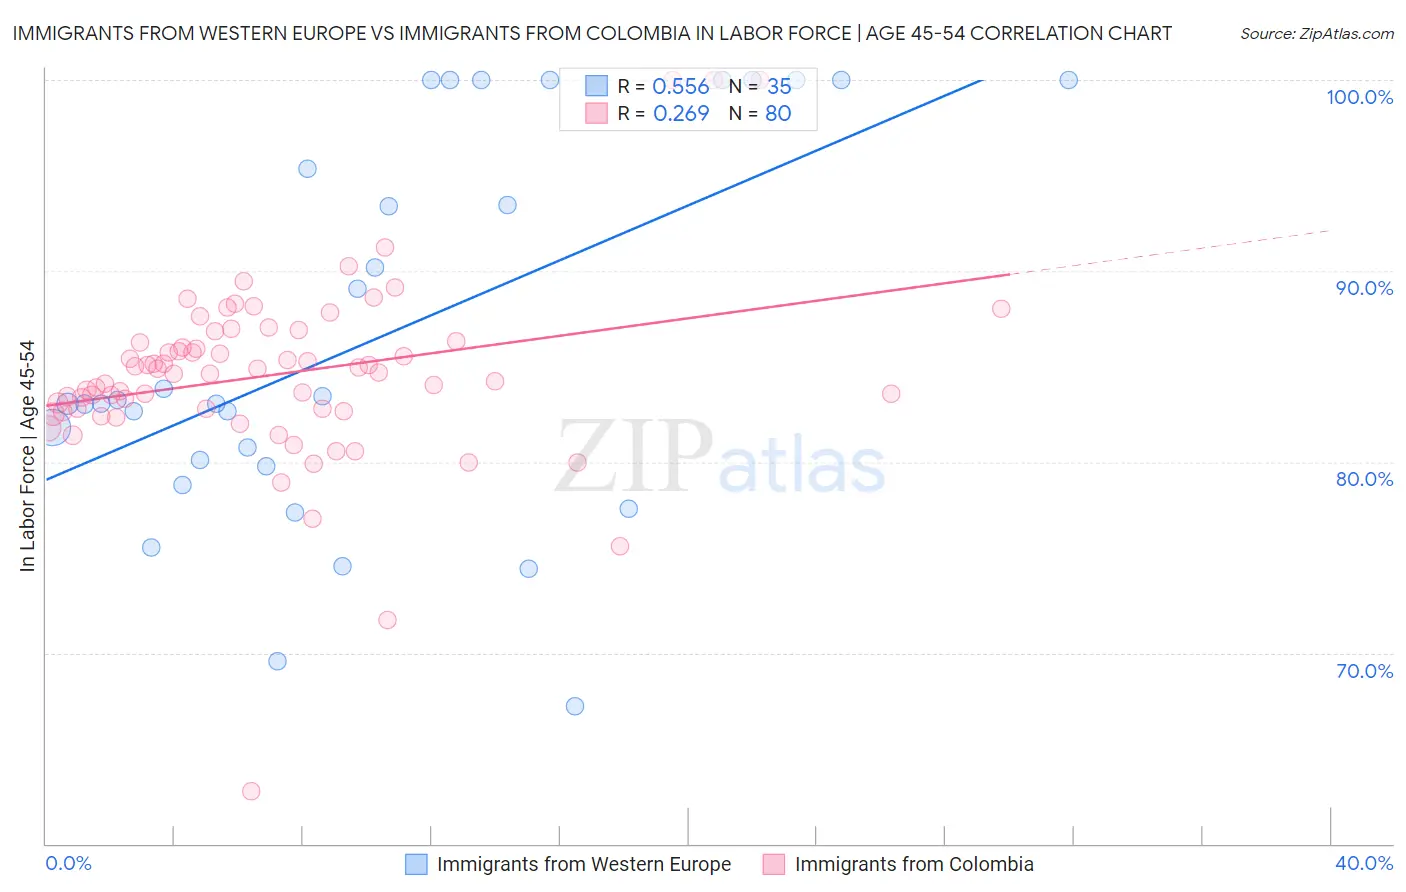
Immigrants from Western Europe vs Immigrants from Colombia In Labor Force | Age 45-54 Correlation Chart

The statistical analysis conducted on geographies consisting of 493,798,681 people shows a substantial positive correlation between the proportion of Immigrants from Western Europe and labor force participation rate among population between the ages 45 and 54 in the United States with a correlation coefficient (R) of 0.556 and weighted average of 82.4%. Similarly, the statistical analysis conducted on geographies consisting of 378,524,126 people shows a weak positive correlation between the proportion of Immigrants from Colombia and labor force participation rate among population between the ages 45 and 54 in the United States with a correlation coefficient (R) of 0.269 and weighted average of 83.4%, a difference of 1.3%.
Immigrants from Western Europe vs Immigrants from Colombia In Labor Force | Age 45-54

In Labor Force | Age 45-54 Correlation Summary

MeasurementImmigrants from Western EuropeImmigrants from Colombia
Minimum67.2%62.7%
Maximum100.0%100.0%
Range32.8%37.3%
Mean86.5%84.6%
Median83.1%84.7%
Interquartile 25% (IQ1)79.8%82.7%
Interquartile 75% (IQ3)100.0%86.3%
Interquartile Range (IQR)20.2%3.6%
Standard Deviation (Sample)10.0%5.0%
Standard Deviation (Population)9.8%5.0%

Similar Demographics by In Labor Force | Age 45-54

Demographics Similar to Immigrants from Western Europe by In Labor Force | Age 45-54

In terms of in labor force | age 45-54, the demographic groups most similar to Immigrants from Western Europe are Arab (82.4%, a difference of 0.010%), Senegalese (82.4%, a difference of 0.030%), Welsh (82.3%, a difference of 0.040%), Immigrants from Cabo Verde (82.3%, a difference of 0.060%), and Native Hawaiian (82.3%, a difference of 0.060%).
DemographicsRating | RankIn Labor Force | Age 45-54
Lebanese
18.2
/100
|
#197
Poor
82.5%
Immigrants | Denmark
17.9
/100
|
#198
Poor
82.5%
Moroccans
15.7
/100
|
#199
Poor
82.5%
French Canadians
15.4
/100
|
#200
Poor
82.5%
Canadians
15.1
/100
|
#201
Poor
82.4%
Immigrants | Western Asia
14.9
/100
|
#202
Poor
82.4%
Arabs
11.6
/100
|
#203
Poor
82.4%
Immigrants | Western Europe
10.9
/100
|
#204
Poor
82.4%
Senegalese
9.5
/100
|
#205
Tragic
82.4%
Welsh
9.2
/100
|
#206
Tragic
82.3%
Immigrants | Cabo Verde
8.6
/100
|
#207
Tragic
82.3%
Native Hawaiians
8.5
/100
|
#208
Tragic
82.3%
Immigrants | Lebanon
7.4
/100
|
#209
Tragic
82.3%
Immigrants | Bahamas
7.1
/100
|
#210
Tragic
82.3%
Immigrants | Syria
6.6
/100
|
#211
Tragic
82.3%

Demographics Similar to Immigrants from Colombia by In Labor Force | Age 45-54

In terms of in labor force | age 45-54, the demographic groups most similar to Immigrants from Colombia are Chilean (83.4%, a difference of 0.010%), Taiwanese (83.4%, a difference of 0.010%), Asian (83.4%, a difference of 0.020%), Immigrants from Latvia (83.4%, a difference of 0.020%), and Colombian (83.4%, a difference of 0.020%).
DemographicsRating | RankIn Labor Force | Age 45-54
Filipinos
98.3
/100
|
#61
Exceptional
83.5%
Immigrants | Taiwan
98.0
/100
|
#62
Exceptional
83.5%
Afghans
97.9
/100
|
#63
Exceptional
83.5%
Immigrants | Kenya
97.9
/100
|
#64
Exceptional
83.5%
Egyptians
97.9
/100
|
#65
Exceptional
83.5%
Asians
97.7
/100
|
#66
Exceptional
83.4%
Chileans
97.7
/100
|
#67
Exceptional
83.4%
Immigrants | Colombia
97.6
/100
|
#68
Exceptional
83.4%
Taiwanese
97.5
/100
|
#69
Exceptional
83.4%
Immigrants | Latvia
97.4
/100
|
#70
Exceptional
83.4%
Colombians
97.3
/100
|
#71
Exceptional
83.4%
Serbians
97.2
/100
|
#72
Exceptional
83.4%
Immigrants | Czechoslovakia
97.1
/100
|
#73
Exceptional
83.4%
Immigrants | Somalia
96.9
/100
|
#74
Exceptional
83.4%
Estonians
96.9
/100
|
#75
Exceptional
83.4%