Apache vs Yuman In Labor Force | Age 45-54
COMPARE
Apache
Yuman
In Labor Force | Age 45-54
In Labor Force | Age 45-54 Comparison
Apache
Yuman
77.1%
IN LABOR FORCE | AGE 45-54
0.0/ 100
METRIC RATING
334th/ 347
METRIC RANK
76.3%
IN LABOR FORCE | AGE 45-54
0.0/ 100
METRIC RATING
338th/ 347
METRIC RANK
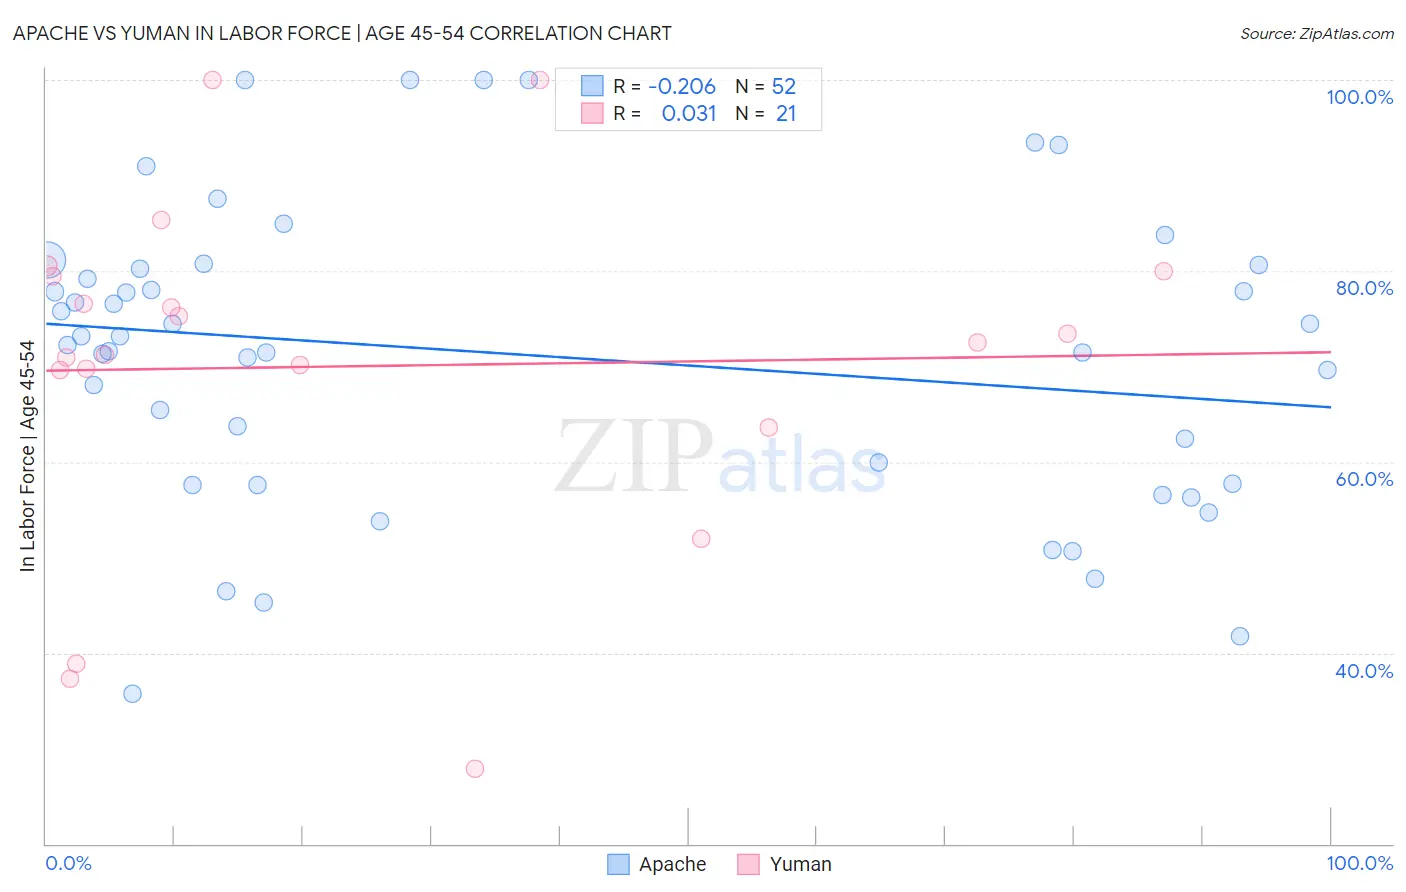
Apache vs Yuman In Labor Force | Age 45-54 Correlation Chart
The statistical analysis conducted on geographies consisting of 231,053,955 people shows a weak negative correlation between the proportion of Apache and labor force participation rate among population between the ages 45 and 54 in the United States with a correlation coefficient (R) of -0.206 and weighted average of 77.1%. Similarly, the statistical analysis conducted on geographies consisting of 40,663,251 people shows no correlation between the proportion of Yuman and labor force participation rate among population between the ages 45 and 54 in the United States with a correlation coefficient (R) of 0.031 and weighted average of 76.3%, a difference of 1.1%.
In Labor Force | Age 45-54 Correlation Summary
| Measurement | Apache | Yuman |
| Minimum | 35.7% | 27.8% |
| Maximum | 100.0% | 100.0% |
| Range | 64.3% | 72.2% |
| Mean | 71.2% | 70.0% |
| Median | 72.7% | 72.5% |
| Interquartile 25% (IQ1) | 57.6% | 66.6% |
| Interquartile 75% (IQ3) | 80.4% | 79.7% |
| Interquartile Range (IQR) | 22.7% | 13.1% |
| Standard Deviation (Sample) | 15.8% | 18.2% |
| Standard Deviation (Population) | 15.6% | 17.8% |
Demographics Similar to Apache and Yuman by In Labor Force | Age 45-54
In terms of in labor force | age 45-54, the demographic groups most similar to Apache are Native/Alaskan (77.1%, a difference of 0.0%), Arapaho (77.1%, a difference of 0.070%), Menominee (77.4%, a difference of 0.36%), Tsimshian (77.4%, a difference of 0.39%), and Cheyenne (77.6%, a difference of 0.54%). Similarly, the demographic groups most similar to Yuman are Ute (76.6%, a difference of 0.41%), Paiute (76.7%, a difference of 0.47%), Puerto Rican (75.9%, a difference of 0.48%), Lumbee (75.6%, a difference of 0.95%), and Arapaho (77.1%, a difference of 1.0%).
| Demographics | Rating | Rank | In Labor Force | Age 45-54 |
| Seminole | 0.0 /100 | #326 | Tragic 78.1% |
| Cajuns | 0.0 /100 | #327 | Tragic 78.1% |
| Sioux | 0.0 /100 | #328 | Tragic 78.0% |
| Creek | 0.0 /100 | #329 | Tragic 77.7% |
| Cheyenne | 0.0 /100 | #330 | Tragic 77.6% |
| Tsimshian | 0.0 /100 | #331 | Tragic 77.4% |
| Menominee | 0.0 /100 | #332 | Tragic 77.4% |
| Natives/Alaskans | 0.0 /100 | #333 | Tragic 77.1% |
| Apache | 0.0 /100 | #334 | Tragic 77.1% |
| Arapaho | 0.0 /100 | #335 | Tragic 77.1% |
| Paiute | 0.0 /100 | #336 | Tragic 76.7% |
| Ute | 0.0 /100 | #337 | Tragic 76.6% |
| Yuman | 0.0 /100 | #338 | Tragic 76.3% |
| Puerto Ricans | 0.0 /100 | #339 | Tragic 75.9% |
| Lumbee | 0.0 /100 | #340 | Tragic 75.6% |
| Pueblo | 0.0 /100 | #341 | Tragic 75.5% |
| Tohono O'odham | 0.0 /100 | #342 | Tragic 75.1% |
| Hopi | 0.0 /100 | #343 | Tragic 75.0% |
| Immigrants | Yemen | 0.0 /100 | #344 | Tragic 74.4% |
| Houma | 0.0 /100 | #345 | Tragic 74.1% |
| Pima | 0.0 /100 | #346 | Tragic 72.8% |