American vs Tohono O'odham In Labor Force | Age 16-19
COMPARE
American
Tohono O'odham
In Labor Force | Age 16-19
In Labor Force | Age 16-19 Comparison
Americans
Tohono O'odham
40.3%
IN LABOR FORCE | AGE 16-19
100.0/ 100
METRIC RATING
61st/ 347
METRIC RANK
31.3%
IN LABOR FORCE | AGE 16-19
0.0/ 100
METRIC RATING
322nd/ 347
METRIC RANK
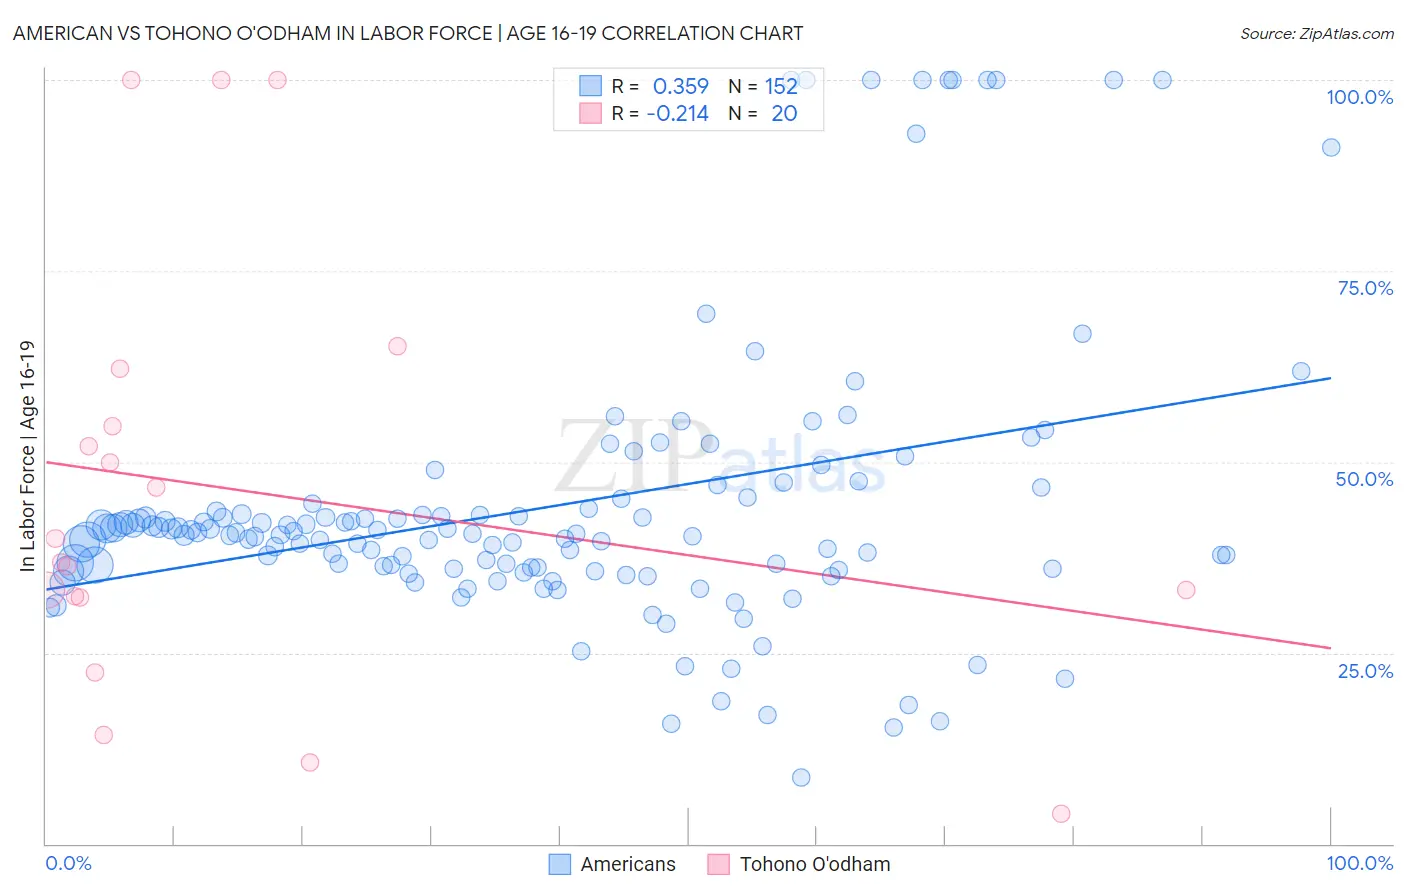
American vs Tohono O'odham In Labor Force | Age 16-19 Correlation Chart
The statistical analysis conducted on geographies consisting of 576,408,281 people shows a mild positive correlation between the proportion of Americans and labor force participation rate among population between the ages 16 and 19 in the United States with a correlation coefficient (R) of 0.359 and weighted average of 40.3%. Similarly, the statistical analysis conducted on geographies consisting of 58,700,142 people shows a weak negative correlation between the proportion of Tohono O'odham and labor force participation rate among population between the ages 16 and 19 in the United States with a correlation coefficient (R) of -0.214 and weighted average of 31.3%, a difference of 28.8%.
In Labor Force | Age 16-19 Correlation Summary
| Measurement | American | Tohono O'odham |
| Minimum | 8.6% | 4.0% |
| Maximum | 100.0% | 100.0% |
| Range | 91.4% | 96.0% |
| Mean | 44.1% | 46.3% |
| Median | 40.6% | 38.3% |
| Interquartile 25% (IQ1) | 36.0% | 32.4% |
| Interquartile 75% (IQ3) | 43.6% | 58.5% |
| Interquartile Range (IQR) | 7.6% | 26.1% |
| Standard Deviation (Sample) | 18.5% | 28.1% |
| Standard Deviation (Population) | 18.5% | 27.4% |
Similar Demographics by In Labor Force | Age 16-19
Demographics Similar to Americans by In Labor Force | Age 16-19
In terms of in labor force | age 16-19, the demographic groups most similar to Americans are Cherokee (40.2%, a difference of 0.14%), Immigrants from Eastern Africa (40.4%, a difference of 0.15%), Slavic (40.4%, a difference of 0.19%), Northern European (40.2%, a difference of 0.20%), and Immigrants from Micronesia (40.2%, a difference of 0.31%).
| Demographics | Rating | Rank | In Labor Force | Age 16-19 |
| Tlingit-Haida | 100.0 /100 | #54 | Exceptional 40.5% |
| British | 100.0 /100 | #55 | Exceptional 40.5% |
| Fijians | 100.0 /100 | #56 | Exceptional 40.4% |
| Lithuanians | 100.0 /100 | #57 | Exceptional 40.4% |
| Aleuts | 100.0 /100 | #58 | Exceptional 40.4% |
| Slavs | 100.0 /100 | #59 | Exceptional 40.4% |
| Immigrants | Eastern Africa | 100.0 /100 | #60 | Exceptional 40.4% |
| Americans | 100.0 /100 | #61 | Exceptional 40.3% |
| Cherokee | 100.0 /100 | #62 | Exceptional 40.2% |
| Northern Europeans | 100.0 /100 | #63 | Exceptional 40.2% |
| Immigrants | Micronesia | 100.0 /100 | #64 | Exceptional 40.2% |
| Kenyans | 100.0 /100 | #65 | Exceptional 40.1% |
| Immigrants | Nonimmigrants | 100.0 /100 | #66 | Exceptional 40.1% |
| Canadians | 100.0 /100 | #67 | Exceptional 40.1% |
| Italians | 99.9 /100 | #68 | Exceptional 40.1% |
Demographics Similar to Tohono O'odham by In Labor Force | Age 16-19
In terms of in labor force | age 16-19, the demographic groups most similar to Tohono O'odham are West Indian (31.3%, a difference of 0.12%), Immigrants from Caribbean (31.2%, a difference of 0.13%), Dominican (31.2%, a difference of 0.31%), Ecuadorian (31.4%, a difference of 0.35%), and Soviet Union (31.4%, a difference of 0.41%).
| Demographics | Rating | Rank | In Labor Force | Age 16-19 |
| Immigrants | West Indies | 0.0 /100 | #315 | Tragic 31.7% |
| Filipinos | 0.0 /100 | #316 | Tragic 31.7% |
| Immigrants | Nicaragua | 0.0 /100 | #317 | Tragic 31.6% |
| Immigrants | Yemen | 0.0 /100 | #318 | Tragic 31.5% |
| Soviet Union | 0.0 /100 | #319 | Tragic 31.4% |
| Ecuadorians | 0.0 /100 | #320 | Tragic 31.4% |
| West Indians | 0.0 /100 | #321 | Tragic 31.3% |
| Tohono O'odham | 0.0 /100 | #322 | Tragic 31.3% |
| Immigrants | Caribbean | 0.0 /100 | #323 | Tragic 31.2% |
| Dominicans | 0.0 /100 | #324 | Tragic 31.2% |
| Immigrants | China | 0.0 /100 | #325 | Tragic 31.1% |
| Immigrants | Dominican Republic | 0.0 /100 | #326 | Tragic 31.1% |
| Immigrants | Taiwan | 0.0 /100 | #327 | Tragic 31.0% |
| Immigrants | Ecuador | 0.0 /100 | #328 | Tragic 31.0% |
| Barbadians | 0.0 /100 | #329 | Tragic 31.0% |