Delaware vs Croatian In Labor Force | Age 25-29
COMPARE
Delaware
Croatian
In Labor Force | Age 25-29
In Labor Force | Age 25-29 Comparison
Delaware
Croatians
83.7%
IN LABOR FORCE | AGE 25-29
0.2/ 100
METRIC RATING
257th/ 347
METRIC RANK
85.8%
IN LABOR FORCE | AGE 25-29
99.9/ 100
METRIC RATING
39th/ 347
METRIC RANK
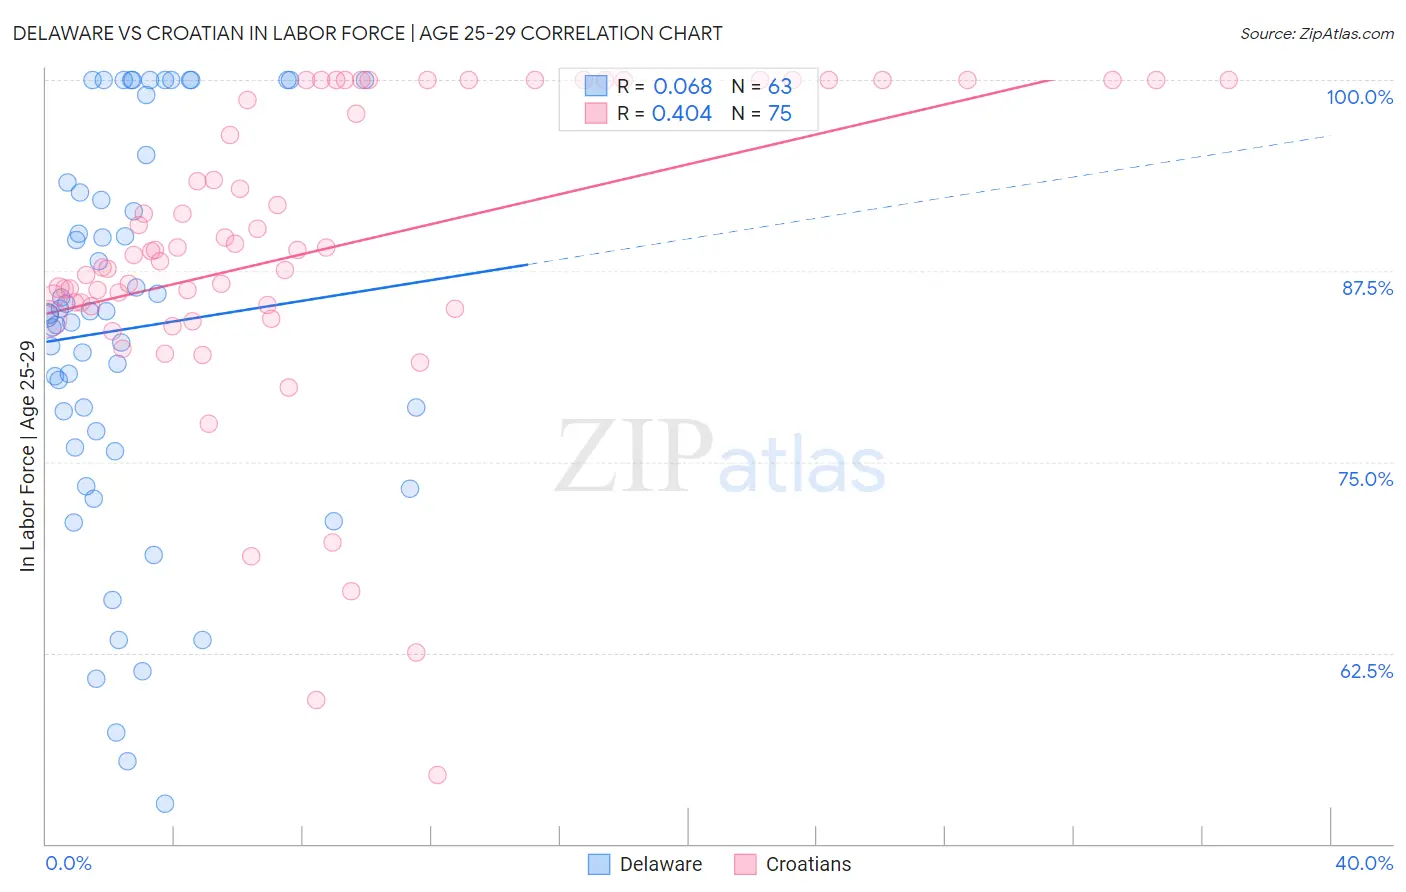
Delaware vs Croatian In Labor Force | Age 25-29 Correlation Chart
The statistical analysis conducted on geographies consisting of 96,226,507 people shows a slight positive correlation between the proportion of Delaware and labor force participation rate among population between the ages 25 and 29 in the United States with a correlation coefficient (R) of 0.068 and weighted average of 83.7%. Similarly, the statistical analysis conducted on geographies consisting of 375,575,461 people shows a moderate positive correlation between the proportion of Croatians and labor force participation rate among population between the ages 25 and 29 in the United States with a correlation coefficient (R) of 0.404 and weighted average of 85.8%, a difference of 2.5%.
In Labor Force | Age 25-29 Correlation Summary
| Measurement | Delaware | Croatian |
| Minimum | 52.6% | 54.5% |
| Maximum | 100.0% | 100.0% |
| Range | 47.4% | 45.5% |
| Mean | 83.7% | 88.9% |
| Median | 84.7% | 88.8% |
| Interquartile 25% (IQ1) | 75.9% | 85.2% |
| Interquartile 75% (IQ3) | 93.3% | 100.0% |
| Interquartile Range (IQR) | 17.4% | 14.8% |
| Standard Deviation (Sample) | 12.8% | 10.0% |
| Standard Deviation (Population) | 12.7% | 10.0% |
Similar Demographics by In Labor Force | Age 25-29
Demographics Similar to Delaware by In Labor Force | Age 25-29
In terms of in labor force | age 25-29, the demographic groups most similar to Delaware are Immigrants from Haiti (83.7%, a difference of 0.010%), Haitian (83.7%, a difference of 0.020%), Guatemalan (83.7%, a difference of 0.030%), Immigrants from Trinidad and Tobago (83.7%, a difference of 0.030%), and Spaniard (83.7%, a difference of 0.030%).
| Demographics | Rating | Rank | In Labor Force | Age 25-29 |
| Central Americans | 0.2 /100 | #250 | Tragic 83.7% |
| Bahamians | 0.2 /100 | #251 | Tragic 83.7% |
| Guatemalans | 0.2 /100 | #252 | Tragic 83.7% |
| Immigrants | Trinidad and Tobago | 0.2 /100 | #253 | Tragic 83.7% |
| Spaniards | 0.2 /100 | #254 | Tragic 83.7% |
| Haitians | 0.2 /100 | #255 | Tragic 83.7% |
| Immigrants | Haiti | 0.2 /100 | #256 | Tragic 83.7% |
| Delaware | 0.2 /100 | #257 | Tragic 83.7% |
| Immigrants | Guatemala | 0.1 /100 | #258 | Tragic 83.6% |
| Spanish | 0.1 /100 | #259 | Tragic 83.6% |
| Immigrants | Bahamas | 0.1 /100 | #260 | Tragic 83.6% |
| Pennsylvania Germans | 0.1 /100 | #261 | Tragic 83.6% |
| Immigrants | Fiji | 0.1 /100 | #262 | Tragic 83.6% |
| West Indians | 0.1 /100 | #263 | Tragic 83.5% |
| Puget Sound Salish | 0.1 /100 | #264 | Tragic 83.5% |
Demographics Similar to Croatians by In Labor Force | Age 25-29
In terms of in labor force | age 25-29, the demographic groups most similar to Croatians are Sierra Leonean (85.8%, a difference of 0.0%), Immigrants from Albania (85.7%, a difference of 0.020%), Polish (85.8%, a difference of 0.030%), Immigrants from Greece (85.7%, a difference of 0.030%), and Immigrants from Nepal (85.8%, a difference of 0.050%).
| Demographics | Rating | Rank | In Labor Force | Age 25-29 |
| Slovaks | 100.0 /100 | #32 | Exceptional 85.8% |
| Immigrants | Bulgaria | 100.0 /100 | #33 | Exceptional 85.8% |
| Lithuanians | 99.9 /100 | #34 | Exceptional 85.8% |
| Cypriots | 99.9 /100 | #35 | Exceptional 85.8% |
| Immigrants | Nepal | 99.9 /100 | #36 | Exceptional 85.8% |
| Poles | 99.9 /100 | #37 | Exceptional 85.8% |
| Sierra Leoneans | 99.9 /100 | #38 | Exceptional 85.8% |
| Croatians | 99.9 /100 | #39 | Exceptional 85.8% |
| Immigrants | Albania | 99.9 /100 | #40 | Exceptional 85.7% |
| Immigrants | Greece | 99.9 /100 | #41 | Exceptional 85.7% |
| Immigrants | Eritrea | 99.9 /100 | #42 | Exceptional 85.7% |
| Immigrants | India | 99.9 /100 | #43 | Exceptional 85.7% |
| Macedonians | 99.9 /100 | #44 | Exceptional 85.7% |
| Immigrants | Sierra Leone | 99.9 /100 | #45 | Exceptional 85.7% |
| Czechs | 99.8 /100 | #46 | Exceptional 85.6% |