Alaska Native vs Austrian Single Father Poverty
COMPARE
Alaska Native
Austrian
Single Father Poverty
Single Father Poverty Comparison
Alaska Natives
Austrians
18.1%
SINGLE FATHER POVERTY
0.0/ 100
METRIC RATING
293rd/ 347
METRIC RANK
17.1%
SINGLE FATHER POVERTY
1.1/ 100
METRIC RATING
250th/ 347
METRIC RANK
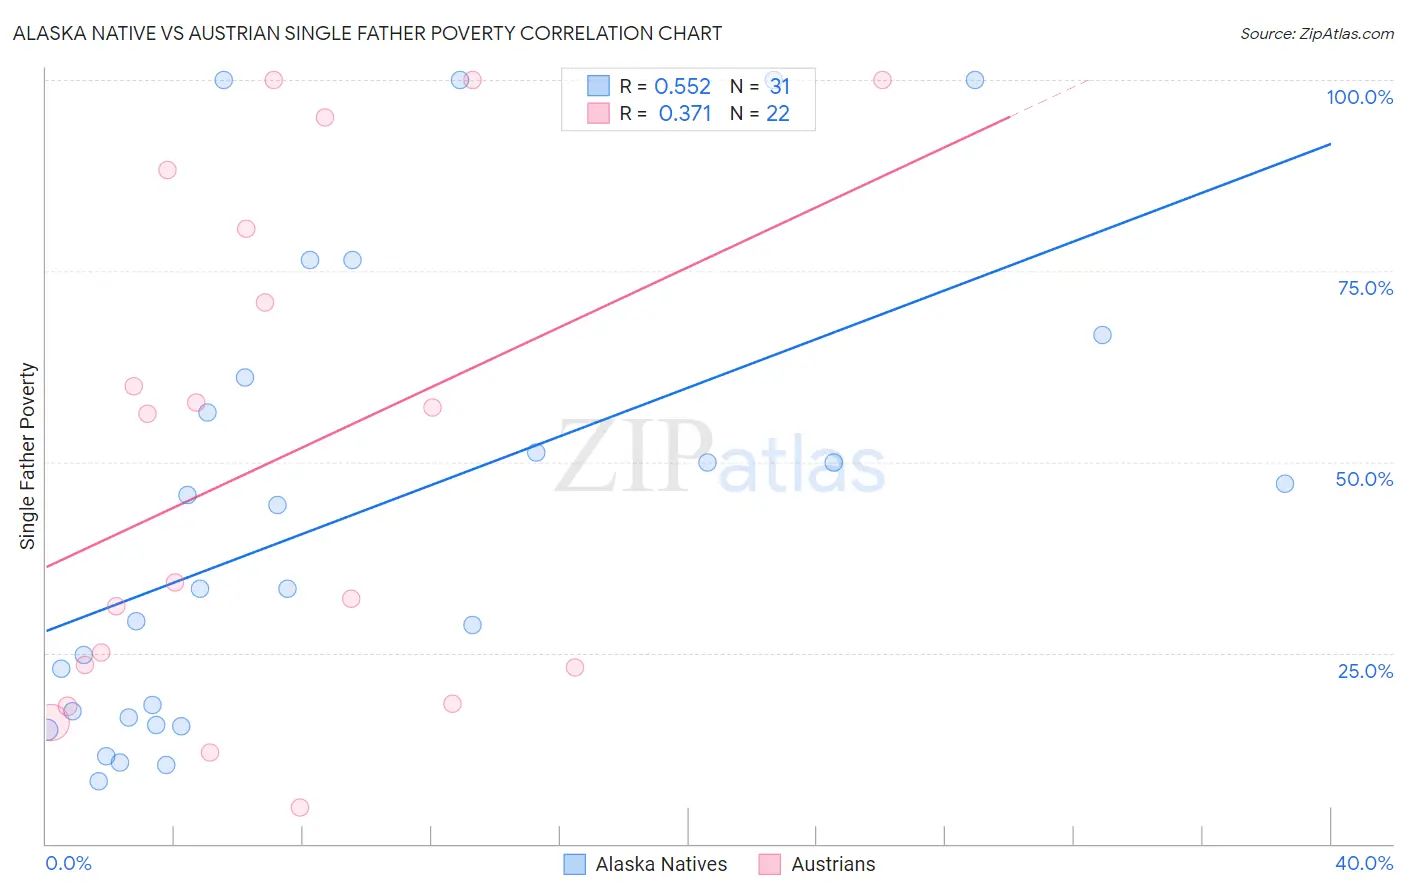
Alaska Native vs Austrian Single Father Poverty Correlation Chart
The statistical analysis conducted on geographies consisting of 71,846,499 people shows a substantial positive correlation between the proportion of Alaska Natives and poverty level among single fathers in the United States with a correlation coefficient (R) of 0.552 and weighted average of 18.1%. Similarly, the statistical analysis conducted on geographies consisting of 340,326,838 people shows a mild positive correlation between the proportion of Austrians and poverty level among single fathers in the United States with a correlation coefficient (R) of 0.371 and weighted average of 17.1%, a difference of 5.9%.
Single Father Poverty Correlation Summary
| Measurement | Alaska Native | Austrian |
| Minimum | 8.1% | 4.8% |
| Maximum | 100.0% | 100.0% |
| Range | 91.9% | 95.2% |
| Mean | 43.1% | 50.2% |
| Median | 33.3% | 45.2% |
| Interquartile 25% (IQ1) | 16.6% | 23.1% |
| Interquartile 75% (IQ3) | 61.0% | 80.6% |
| Interquartile Range (IQR) | 44.4% | 57.5% |
| Standard Deviation (Sample) | 29.7% | 32.6% |
| Standard Deviation (Population) | 29.2% | 31.8% |
Similar Demographics by Single Father Poverty
Demographics Similar to Alaska Natives by Single Father Poverty
In terms of single father poverty, the demographic groups most similar to Alaska Natives are U.S. Virgin Islander (18.1%, a difference of 0.030%), Yakama (18.1%, a difference of 0.090%), Immigrants from Bahamas (18.1%, a difference of 0.11%), Alaskan Athabascan (18.1%, a difference of 0.12%), and Seminole (18.1%, a difference of 0.19%).
| Demographics | Rating | Rank | Single Father Poverty |
| Immigrants | North Macedonia | 0.0 /100 | #286 | Tragic 17.9% |
| Carpatho Rusyns | 0.0 /100 | #287 | Tragic 18.0% |
| Bahamians | 0.0 /100 | #288 | Tragic 18.0% |
| Irish | 0.0 /100 | #289 | Tragic 18.0% |
| West Indians | 0.0 /100 | #290 | Tragic 18.0% |
| Alaskan Athabascans | 0.0 /100 | #291 | Tragic 18.1% |
| Immigrants | Bahamas | 0.0 /100 | #292 | Tragic 18.1% |
| Alaska Natives | 0.0 /100 | #293 | Tragic 18.1% |
| U.S. Virgin Islanders | 0.0 /100 | #294 | Tragic 18.1% |
| Yakama | 0.0 /100 | #295 | Tragic 18.1% |
| Seminole | 0.0 /100 | #296 | Tragic 18.1% |
| French | 0.0 /100 | #297 | Tragic 18.2% |
| Africans | 0.0 /100 | #298 | Tragic 18.3% |
| Whites/Caucasians | 0.0 /100 | #299 | Tragic 18.4% |
| Immigrants | Dominican Republic | 0.0 /100 | #300 | Tragic 18.4% |
Demographics Similar to Austrians by Single Father Poverty
In terms of single father poverty, the demographic groups most similar to Austrians are Luxembourger (17.1%, a difference of 0.010%), Croatian (17.1%, a difference of 0.11%), Cree (17.1%, a difference of 0.11%), Canadian (17.1%, a difference of 0.13%), and Czechoslovakian (17.1%, a difference of 0.17%).
| Demographics | Rating | Rank | Single Father Poverty |
| Immigrants | Cabo Verde | 1.6 /100 | #243 | Tragic 17.0% |
| Hondurans | 1.6 /100 | #244 | Tragic 17.0% |
| Trinidadians and Tobagonians | 1.5 /100 | #245 | Tragic 17.0% |
| Immigrants | Ireland | 1.4 /100 | #246 | Tragic 17.1% |
| Greeks | 1.3 /100 | #247 | Tragic 17.1% |
| Czechoslovakians | 1.3 /100 | #248 | Tragic 17.1% |
| Canadians | 1.3 /100 | #249 | Tragic 17.1% |
| Austrians | 1.1 /100 | #250 | Tragic 17.1% |
| Luxembourgers | 1.1 /100 | #251 | Tragic 17.1% |
| Croatians | 1.0 /100 | #252 | Tragic 17.1% |
| Cree | 1.0 /100 | #253 | Tragic 17.1% |
| Immigrants | Honduras | 0.9 /100 | #254 | Tragic 17.1% |
| Sierra Leoneans | 0.8 /100 | #255 | Tragic 17.2% |
| Immigrants | Haiti | 0.8 /100 | #256 | Tragic 17.2% |
| Immigrants | Albania | 0.7 /100 | #257 | Tragic 17.2% |