Afghan vs Cree In Labor Force | Age 25-29
COMPARE
Afghan
Cree
In Labor Force | Age 25-29
In Labor Force | Age 25-29 Comparison
Afghans
Cree
84.4%
IN LABOR FORCE | AGE 25-29
15.9/ 100
METRIC RATING
202nd/ 347
METRIC RANK
83.8%
IN LABOR FORCE | AGE 25-29
0.3/ 100
METRIC RATING
246th/ 347
METRIC RANK
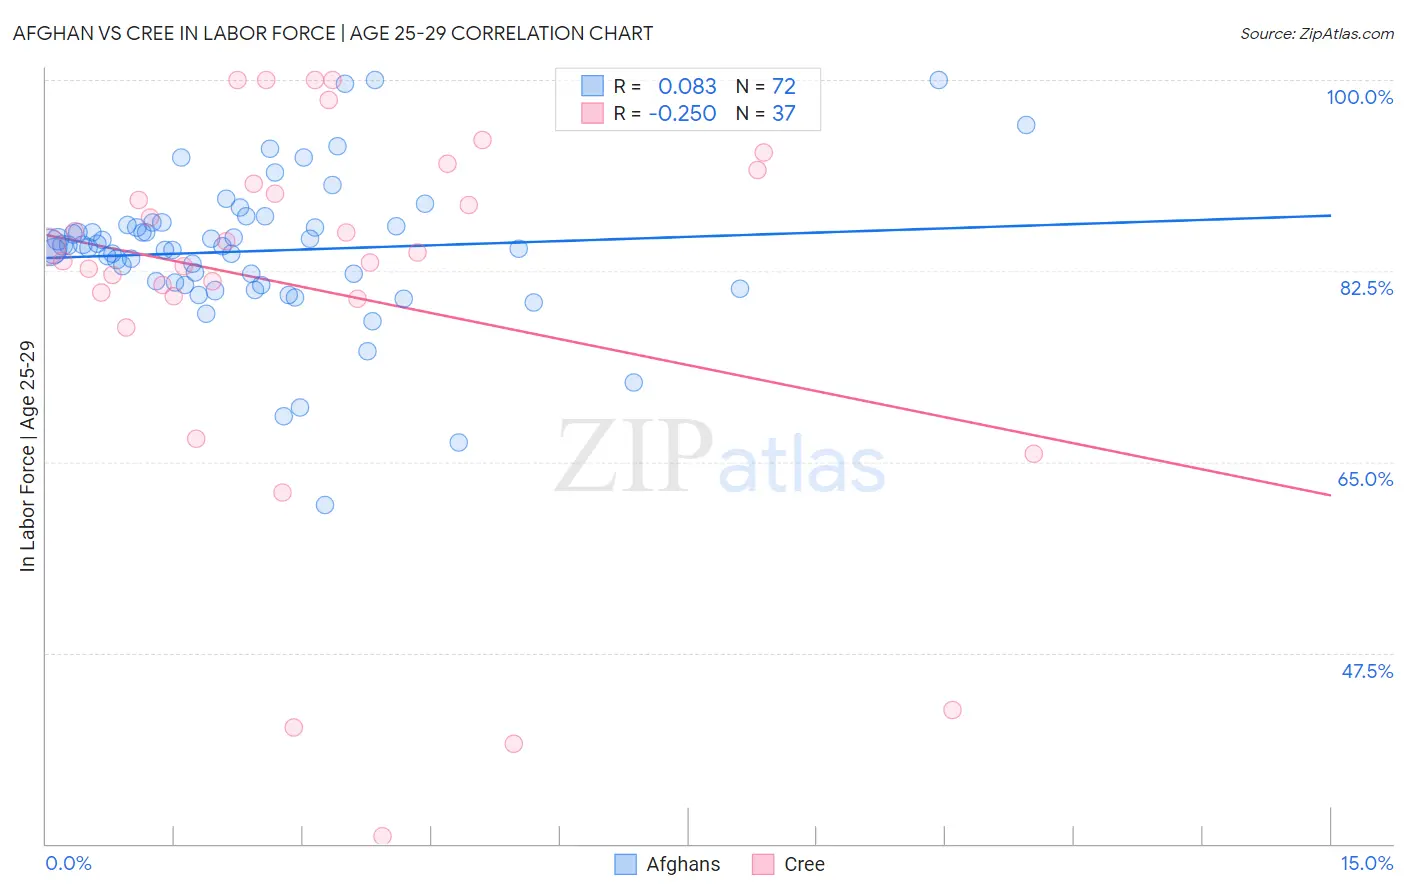
Afghan vs Cree In Labor Force | Age 25-29 Correlation Chart
The statistical analysis conducted on geographies consisting of 148,868,617 people shows a slight positive correlation between the proportion of Afghans and labor force participation rate among population between the ages 25 and 29 in the United States with a correlation coefficient (R) of 0.083 and weighted average of 84.4%. Similarly, the statistical analysis conducted on geographies consisting of 76,193,798 people shows a weak negative correlation between the proportion of Cree and labor force participation rate among population between the ages 25 and 29 in the United States with a correlation coefficient (R) of -0.250 and weighted average of 83.8%, a difference of 0.76%.
In Labor Force | Age 25-29 Correlation Summary
| Measurement | Afghan | Cree |
| Minimum | 61.1% | 30.7% |
| Maximum | 100.0% | 100.0% |
| Range | 38.9% | 69.3% |
| Mean | 84.3% | 80.7% |
| Median | 84.7% | 84.2% |
| Interquartile 25% (IQ1) | 81.3% | 80.1% |
| Interquartile 75% (IQ3) | 86.7% | 91.1% |
| Interquartile Range (IQR) | 5.4% | 11.0% |
| Standard Deviation (Sample) | 6.7% | 17.4% |
| Standard Deviation (Population) | 6.6% | 17.2% |
Similar Demographics by In Labor Force | Age 25-29
Demographics Similar to Afghans by In Labor Force | Age 25-29
In terms of in labor force | age 25-29, the demographic groups most similar to Afghans are Immigrants from Afghanistan (84.4%, a difference of 0.0%), Laotian (84.4%, a difference of 0.010%), Venezuelan (84.4%, a difference of 0.010%), Immigrants from Kazakhstan (84.4%, a difference of 0.020%), and Ecuadorian (84.4%, a difference of 0.020%).
| Demographics | Rating | Rank | In Labor Force | Age 25-29 |
| Immigrants | Israel | 20.8 /100 | #195 | Fair 84.4% |
| Immigrants | South Eastern Asia | 19.5 /100 | #196 | Poor 84.4% |
| Tlingit-Haida | 19.3 /100 | #197 | Poor 84.4% |
| Immigrants | Iraq | 19.0 /100 | #198 | Poor 84.4% |
| Immigrants | Germany | 18.3 /100 | #199 | Poor 84.4% |
| Immigrants | Kazakhstan | 17.5 /100 | #200 | Poor 84.4% |
| Laotians | 16.6 /100 | #201 | Poor 84.4% |
| Afghans | 15.9 /100 | #202 | Poor 84.4% |
| Immigrants | Afghanistan | 15.6 /100 | #203 | Poor 84.4% |
| Venezuelans | 15.1 /100 | #204 | Poor 84.4% |
| Ecuadorians | 14.8 /100 | #205 | Poor 84.4% |
| Immigrants | Cambodia | 14.3 /100 | #206 | Poor 84.4% |
| Immigrants | Armenia | 13.3 /100 | #207 | Poor 84.4% |
| Immigrants | Indonesia | 13.2 /100 | #208 | Poor 84.4% |
| Immigrants | Jordan | 12.8 /100 | #209 | Poor 84.4% |
Demographics Similar to Cree by In Labor Force | Age 25-29
In terms of in labor force | age 25-29, the demographic groups most similar to Cree are Immigrants from El Salvador (83.7%, a difference of 0.020%), Nonimmigrants (83.7%, a difference of 0.030%), Hmong (83.7%, a difference of 0.040%), Immigrants from Jamaica (83.8%, a difference of 0.050%), and Iroquois (83.8%, a difference of 0.050%).
| Demographics | Rating | Rank | In Labor Force | Age 25-29 |
| Jamaicans | 0.8 /100 | #239 | Tragic 83.9% |
| Trinidadians and Tobagonians | 0.7 /100 | #240 | Tragic 83.9% |
| Alsatians | 0.7 /100 | #241 | Tragic 83.9% |
| U.S. Virgin Islanders | 0.6 /100 | #242 | Tragic 83.8% |
| Salvadorans | 0.5 /100 | #243 | Tragic 83.8% |
| Immigrants | Jamaica | 0.4 /100 | #244 | Tragic 83.8% |
| Iroquois | 0.4 /100 | #245 | Tragic 83.8% |
| Cree | 0.3 /100 | #246 | Tragic 83.8% |
| Immigrants | El Salvador | 0.3 /100 | #247 | Tragic 83.7% |
| Immigrants | Nonimmigrants | 0.3 /100 | #248 | Tragic 83.7% |
| Hmong | 0.3 /100 | #249 | Tragic 83.7% |
| Central Americans | 0.2 /100 | #250 | Tragic 83.7% |
| Bahamians | 0.2 /100 | #251 | Tragic 83.7% |
| Guatemalans | 0.2 /100 | #252 | Tragic 83.7% |
| Immigrants | Trinidad and Tobago | 0.2 /100 | #253 | Tragic 83.7% |