Afghan vs South American Indian Unemployment Among Ages 55 to 59 years
COMPARE
Afghan
South American Indian
Unemployment Among Ages 55 to 59 years
Unemployment Among Ages 55 to 59 years Comparison
Afghans
South American Indians
4.7%
UNEMPLOYMENT AMONG AGES 55 TO 59 YEARS
92.1/ 100
METRIC RATING
112th/ 347
METRIC RANK
4.7%
UNEMPLOYMENT AMONG AGES 55 TO 59 YEARS
90.9/ 100
METRIC RATING
115th/ 347
METRIC RANK
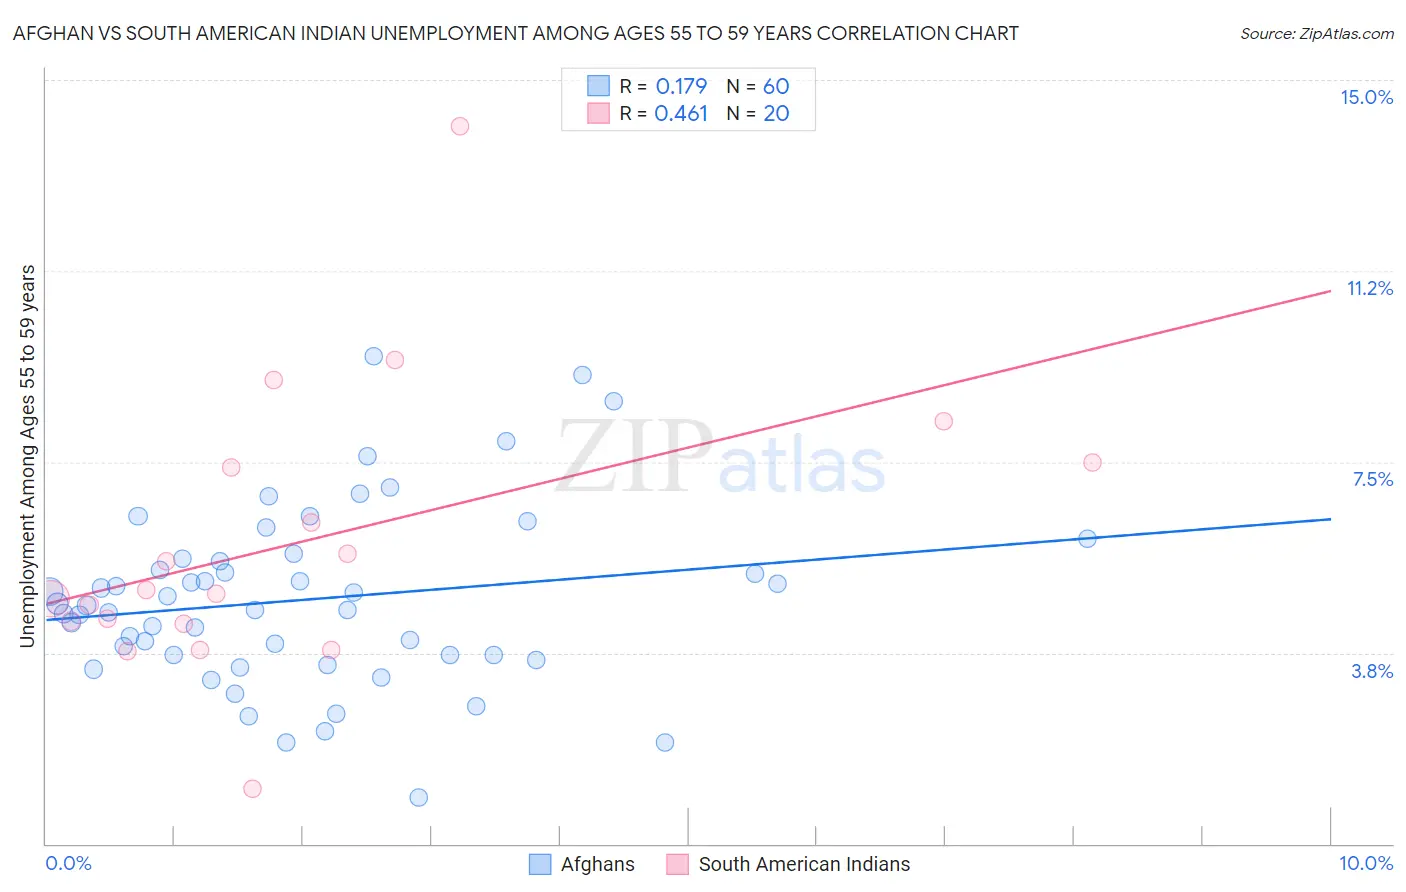
Afghan vs South American Indian Unemployment Among Ages 55 to 59 years Correlation Chart
The statistical analysis conducted on geographies consisting of 145,461,524 people shows a poor positive correlation between the proportion of Afghans and unemployment rate among population between the ages 55 and 59 in the United States with a correlation coefficient (R) of 0.179 and weighted average of 4.7%. Similarly, the statistical analysis conducted on geographies consisting of 160,494,034 people shows a moderate positive correlation between the proportion of South American Indians and unemployment rate among population between the ages 55 and 59 in the United States with a correlation coefficient (R) of 0.461 and weighted average of 4.7%, a difference of 0.17%.
Unemployment Among Ages 55 to 59 years Correlation Summary
| Measurement | Afghan | South American Indian |
| Minimum | 0.90% | 1.1% |
| Maximum | 9.6% | 14.1% |
| Range | 8.7% | 13.0% |
| Mean | 4.8% | 5.9% |
| Median | 4.6% | 4.9% |
| Interquartile 25% (IQ1) | 3.7% | 4.3% |
| Interquartile 75% (IQ3) | 5.6% | 7.4% |
| Interquartile Range (IQR) | 1.9% | 3.1% |
| Standard Deviation (Sample) | 1.7% | 2.8% |
| Standard Deviation (Population) | 1.7% | 2.7% |
Demographics Similar to Afghans and South American Indians by Unemployment Among Ages 55 to 59 years
In terms of unemployment among ages 55 to 59 years, the demographic groups most similar to Afghans are Austrian (4.7%, a difference of 0.040%), Immigrants from Spain (4.7%, a difference of 0.10%), Egyptian (4.7%, a difference of 0.11%), Bangladeshi (4.7%, a difference of 0.11%), and French (4.7%, a difference of 0.17%). Similarly, the demographic groups most similar to South American Indians are Turkish (4.7%, a difference of 0.0%), Asian (4.7%, a difference of 0.010%), Immigrants from Chile (4.7%, a difference of 0.030%), White/Caucasian (4.7%, a difference of 0.030%), and Bangladeshi (4.7%, a difference of 0.060%).
| Demographics | Rating | Rank | Unemployment Among Ages 55 to 59 years |
| Immigrants | Oceania | 94.0 /100 | #103 | Exceptional 4.7% |
| Immigrants | Turkey | 93.9 /100 | #104 | Exceptional 4.7% |
| Immigrants | North America | 93.9 /100 | #105 | Exceptional 4.7% |
| Immigrants | Laos | 93.9 /100 | #106 | Exceptional 4.7% |
| Immigrants | Egypt | 93.5 /100 | #107 | Exceptional 4.7% |
| French | 93.3 /100 | #108 | Exceptional 4.7% |
| Chileans | 93.2 /100 | #109 | Exceptional 4.7% |
| Egyptians | 92.9 /100 | #110 | Exceptional 4.7% |
| Austrians | 92.4 /100 | #111 | Exceptional 4.7% |
| Afghans | 92.1 /100 | #112 | Exceptional 4.7% |
| Immigrants | Spain | 91.4 /100 | #113 | Exceptional 4.7% |
| Bangladeshis | 91.3 /100 | #114 | Exceptional 4.7% |
| South American Indians | 90.9 /100 | #115 | Exceptional 4.7% |
| Turks | 90.9 /100 | #116 | Exceptional 4.7% |
| Asians | 90.8 /100 | #117 | Exceptional 4.7% |
| Immigrants | Chile | 90.7 /100 | #118 | Exceptional 4.7% |
| Whites/Caucasians | 90.7 /100 | #119 | Exceptional 4.7% |
| Immigrants | South Africa | 89.9 /100 | #120 | Excellent 4.7% |
| Pakistanis | 89.7 /100 | #121 | Excellent 4.7% |
| Immigrants | Afghanistan | 89.5 /100 | #122 | Excellent 4.7% |
| Immigrants | Japan | 89.4 /100 | #123 | Excellent 4.7% |