Zimbabwean vs Serbian Householder Income Over 65 years
COMPARE
Zimbabwean
Serbian
Householder Income Over 65 years
Householder Income Over 65 years Comparison
Zimbabweans
Serbians
$65,854
HOUSEHOLDER INCOME OVER 65 YEARS
99.4/ 100
METRIC RATING
64th/ 347
METRIC RANK
$61,087
HOUSEHOLDER INCOME OVER 65 YEARS
53.1/ 100
METRIC RATING
170th/ 347
METRIC RANK
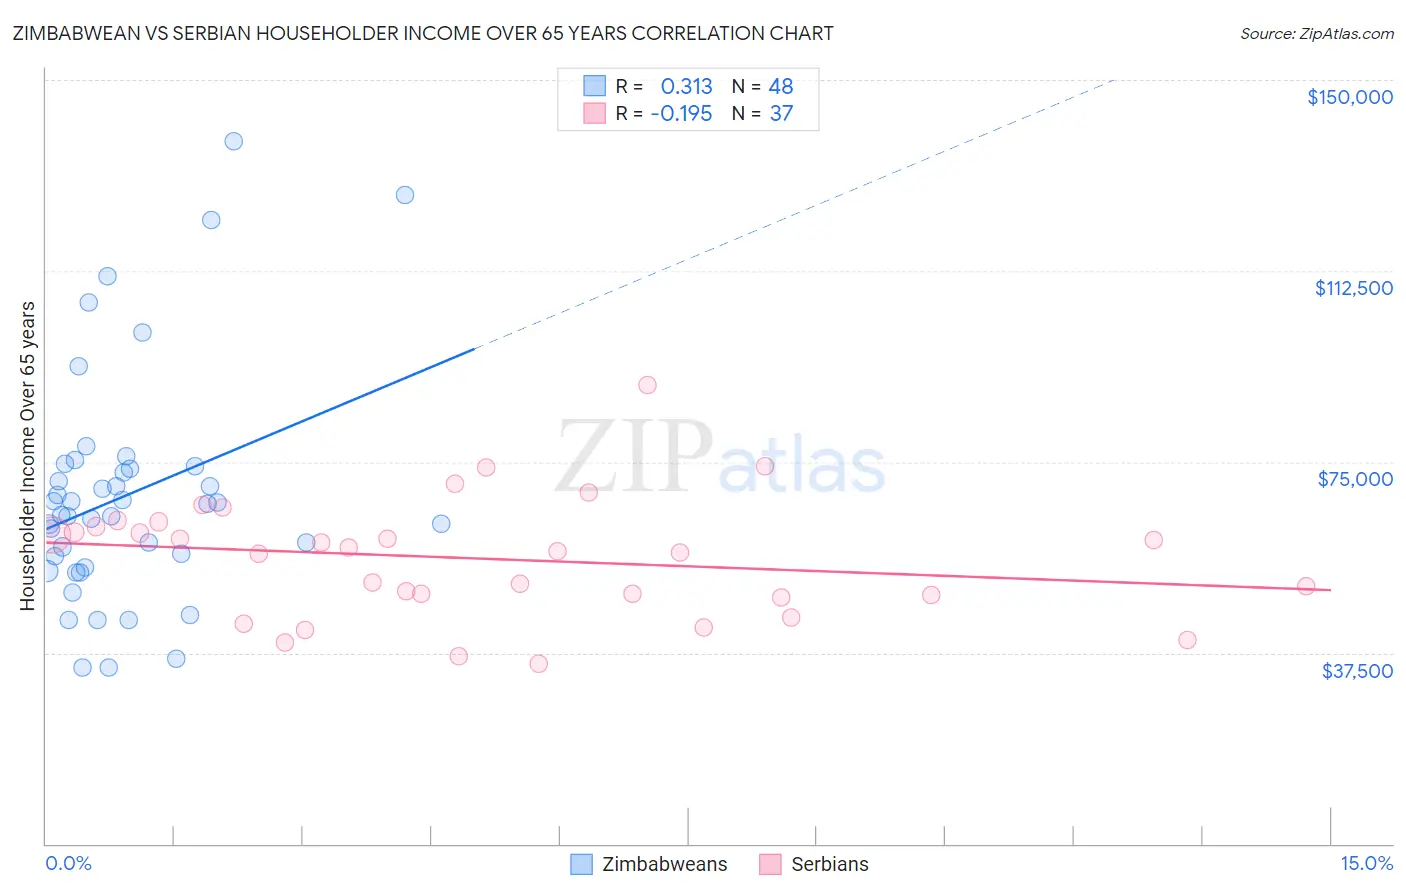
Zimbabwean vs Serbian Householder Income Over 65 years Correlation Chart
The statistical analysis conducted on geographies consisting of 69,104,577 people shows a mild positive correlation between the proportion of Zimbabweans and household income with householder over the age of 65 in the United States with a correlation coefficient (R) of 0.313 and weighted average of $65,854. Similarly, the statistical analysis conducted on geographies consisting of 267,254,398 people shows a poor negative correlation between the proportion of Serbians and household income with householder over the age of 65 in the United States with a correlation coefficient (R) of -0.195 and weighted average of $61,087, a difference of 7.8%.
Householder Income Over 65 years Correlation Summary
| Measurement | Zimbabwean | Serbian |
| Minimum | $34,500 | $35,417 |
| Maximum | $137,885 | $89,997 |
| Range | $103,385 | $54,580 |
| Mean | $68,543 | $56,009 |
| Median | $65,700 | $57,358 |
| Interquartile 25% (IQ1) | $55,350 | $48,698 |
| Interquartile 75% (IQ3) | $73,919 | $62,751 |
| Interquartile Range (IQR) | $18,569 | $14,053 |
| Standard Deviation (Sample) | $22,680 | $11,788 |
| Standard Deviation (Population) | $22,443 | $11,628 |
Similar Demographics by Householder Income Over 65 years
Demographics Similar to Zimbabweans by Householder Income Over 65 years
In terms of householder income over 65 years, the demographic groups most similar to Zimbabweans are Marshallese ($65,874, a difference of 0.030%), Immigrants from England ($65,715, a difference of 0.21%), Immigrants from Sierra Leone ($66,009, a difference of 0.23%), Maltese ($66,027, a difference of 0.26%), and South African ($65,652, a difference of 0.31%).
| Demographics | Rating | Rank | Householder Income Over 65 years |
| Bulgarians | 99.6 /100 | #57 | Exceptional $66,236 |
| Immigrants | Philippines | 99.6 /100 | #58 | Exceptional $66,161 |
| Immigrants | Norway | 99.5 /100 | #59 | Exceptional $66,118 |
| Immigrants | Lithuania | 99.5 /100 | #60 | Exceptional $66,087 |
| Maltese | 99.5 /100 | #61 | Exceptional $66,027 |
| Immigrants | Sierra Leone | 99.5 /100 | #62 | Exceptional $66,009 |
| Marshallese | 99.4 /100 | #63 | Exceptional $65,874 |
| Zimbabweans | 99.4 /100 | #64 | Exceptional $65,854 |
| Immigrants | England | 99.3 /100 | #65 | Exceptional $65,715 |
| South Africans | 99.3 /100 | #66 | Exceptional $65,652 |
| Immigrants | Malaysia | 99.1 /100 | #67 | Exceptional $65,497 |
| Egyptians | 99.1 /100 | #68 | Exceptional $65,441 |
| Samoans | 99.1 /100 | #69 | Exceptional $65,427 |
| Mongolians | 99.0 /100 | #70 | Exceptional $65,326 |
| Greeks | 98.9 /100 | #71 | Exceptional $65,306 |
Demographics Similar to Serbians by Householder Income Over 65 years
In terms of householder income over 65 years, the demographic groups most similar to Serbians are Carpatho Rusyn ($61,093, a difference of 0.010%), Irish ($61,097, a difference of 0.020%), Norwegian ($61,104, a difference of 0.030%), Inupiat ($61,061, a difference of 0.040%), and Immigrants from Poland ($61,041, a difference of 0.080%).
| Demographics | Rating | Rank | Householder Income Over 65 years |
| Ugandans | 55.5 /100 | #163 | Average $61,177 |
| Immigrants | North Macedonia | 55.4 /100 | #164 | Average $61,175 |
| Immigrants | Ukraine | 55.1 /100 | #165 | Average $61,163 |
| Immigrants | Eastern Africa | 55.0 /100 | #166 | Average $61,157 |
| Norwegians | 53.6 /100 | #167 | Average $61,104 |
| Irish | 53.4 /100 | #168 | Average $61,097 |
| Carpatho Rusyns | 53.3 /100 | #169 | Average $61,093 |
| Serbians | 53.1 /100 | #170 | Average $61,087 |
| Inupiat | 52.4 /100 | #171 | Average $61,061 |
| Immigrants | Poland | 51.9 /100 | #172 | Average $61,041 |
| Immigrants | Micronesia | 50.8 /100 | #173 | Average $61,000 |
| Luxembourgers | 50.0 /100 | #174 | Average $60,967 |
| Spaniards | 47.3 /100 | #175 | Average $60,866 |
| Spanish | 45.5 /100 | #176 | Average $60,795 |
| Alaska Natives | 44.3 /100 | #177 | Average $60,748 |