Immigrants from Uruguay vs Serbian Householder Income Over 65 years
COMPARE
Immigrants from Uruguay
Serbian
Householder Income Over 65 years
Householder Income Over 65 years Comparison
Immigrants from Uruguay
Serbians
$56,975
HOUSEHOLDER INCOME OVER 65 YEARS
1.5/ 100
METRIC RATING
236th/ 347
METRIC RANK
$61,087
HOUSEHOLDER INCOME OVER 65 YEARS
53.1/ 100
METRIC RATING
170th/ 347
METRIC RANK
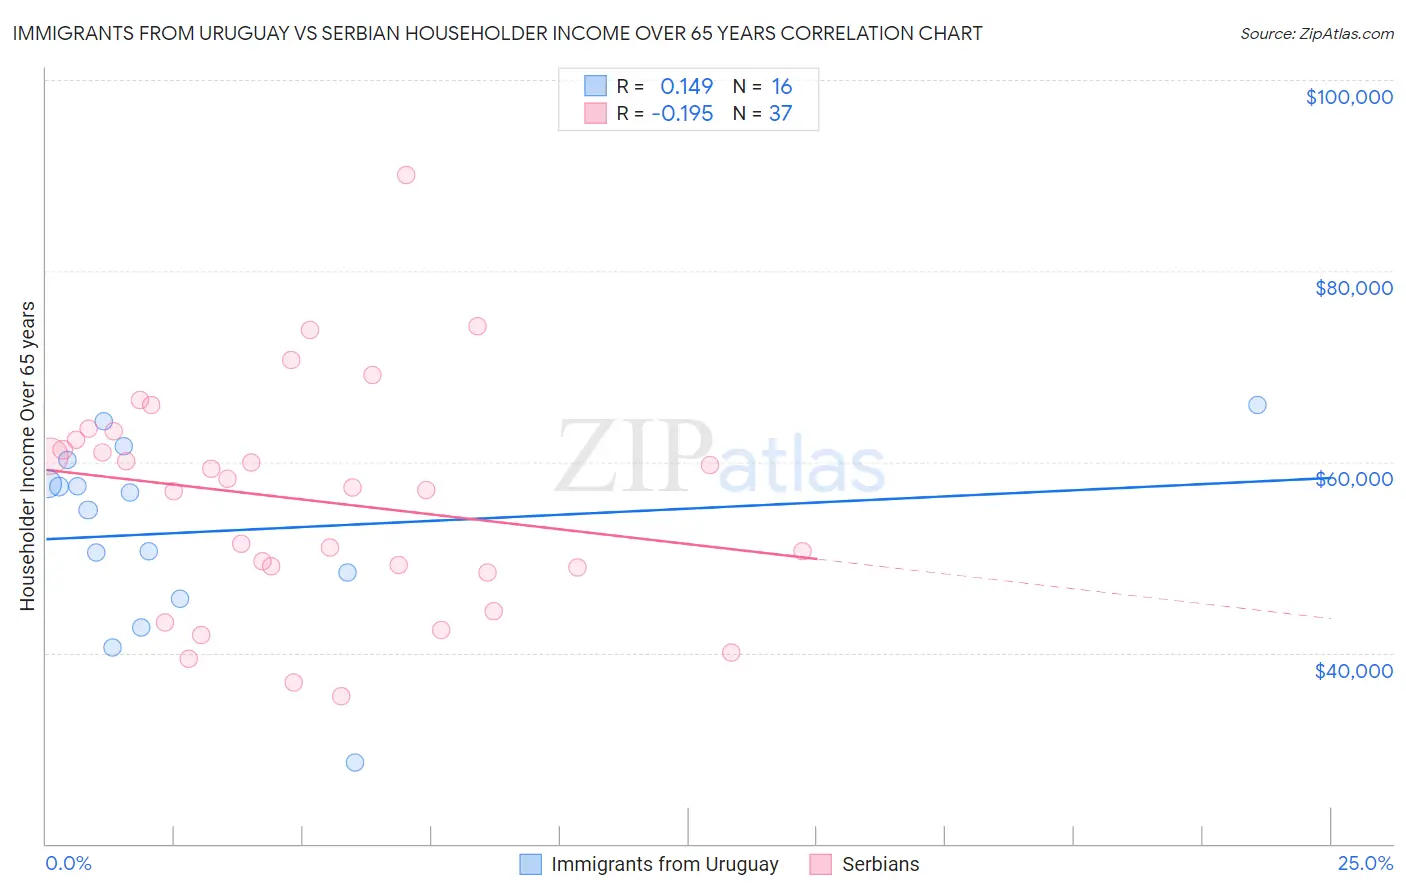
Immigrants from Uruguay vs Serbian Householder Income Over 65 years Correlation Chart
The statistical analysis conducted on geographies consisting of 133,209,862 people shows a poor positive correlation between the proportion of Immigrants from Uruguay and household income with householder over the age of 65 in the United States with a correlation coefficient (R) of 0.149 and weighted average of $56,975. Similarly, the statistical analysis conducted on geographies consisting of 267,254,398 people shows a poor negative correlation between the proportion of Serbians and household income with householder over the age of 65 in the United States with a correlation coefficient (R) of -0.195 and weighted average of $61,087, a difference of 7.2%.
Householder Income Over 65 years Correlation Summary
| Measurement | Immigrants from Uruguay | Serbian |
| Minimum | $28,542 | $35,417 |
| Maximum | $65,972 | $89,997 |
| Range | $37,430 | $54,580 |
| Mean | $52,708 | $56,009 |
| Median | $55,916 | $57,358 |
| Interquartile 25% (IQ1) | $47,054 | $48,698 |
| Interquartile 75% (IQ3) | $58,928 | $62,751 |
| Interquartile Range (IQR) | $11,874 | $14,053 |
| Standard Deviation (Sample) | $9,823 | $11,788 |
| Standard Deviation (Population) | $9,511 | $11,628 |
Similar Demographics by Householder Income Over 65 years
Demographics Similar to Immigrants from Uruguay by Householder Income Over 65 years
In terms of householder income over 65 years, the demographic groups most similar to Immigrants from Uruguay are Immigrants from Panama ($56,944, a difference of 0.050%), Spanish American ($57,021, a difference of 0.080%), Immigrants from Burma/Myanmar ($57,114, a difference of 0.24%), Immigrants from Western Africa ($57,119, a difference of 0.25%), and Fijian ($56,768, a difference of 0.36%).
| Demographics | Rating | Rank | Householder Income Over 65 years |
| Immigrants | Colombia | 3.0 /100 | #229 | Tragic $57,658 |
| Immigrants | Cambodia | 2.8 /100 | #230 | Tragic $57,580 |
| Immigrants | Nonimmigrants | 2.4 /100 | #231 | Tragic $57,426 |
| Immigrants | Venezuela | 2.3 /100 | #232 | Tragic $57,371 |
| Immigrants | Western Africa | 1.7 /100 | #233 | Tragic $57,119 |
| Immigrants | Burma/Myanmar | 1.7 /100 | #234 | Tragic $57,114 |
| Spanish Americans | 1.6 /100 | #235 | Tragic $57,021 |
| Immigrants | Uruguay | 1.5 /100 | #236 | Tragic $56,975 |
| Immigrants | Panama | 1.5 /100 | #237 | Tragic $56,944 |
| Fijians | 1.2 /100 | #238 | Tragic $56,768 |
| Immigrants | Laos | 1.2 /100 | #239 | Tragic $56,722 |
| Sub-Saharan Africans | 1.0 /100 | #240 | Tragic $56,615 |
| Immigrants | Guyana | 0.9 /100 | #241 | Tragic $56,495 |
| Yaqui | 0.8 /100 | #242 | Tragic $56,417 |
| Guyanese | 0.8 /100 | #243 | Tragic $56,351 |
Demographics Similar to Serbians by Householder Income Over 65 years
In terms of householder income over 65 years, the demographic groups most similar to Serbians are Carpatho Rusyn ($61,093, a difference of 0.010%), Irish ($61,097, a difference of 0.020%), Norwegian ($61,104, a difference of 0.030%), Inupiat ($61,061, a difference of 0.040%), and Immigrants from Poland ($61,041, a difference of 0.080%).
| Demographics | Rating | Rank | Householder Income Over 65 years |
| Ugandans | 55.5 /100 | #163 | Average $61,177 |
| Immigrants | North Macedonia | 55.4 /100 | #164 | Average $61,175 |
| Immigrants | Ukraine | 55.1 /100 | #165 | Average $61,163 |
| Immigrants | Eastern Africa | 55.0 /100 | #166 | Average $61,157 |
| Norwegians | 53.6 /100 | #167 | Average $61,104 |
| Irish | 53.4 /100 | #168 | Average $61,097 |
| Carpatho Rusyns | 53.3 /100 | #169 | Average $61,093 |
| Serbians | 53.1 /100 | #170 | Average $61,087 |
| Inupiat | 52.4 /100 | #171 | Average $61,061 |
| Immigrants | Poland | 51.9 /100 | #172 | Average $61,041 |
| Immigrants | Micronesia | 50.8 /100 | #173 | Average $61,000 |
| Luxembourgers | 50.0 /100 | #174 | Average $60,967 |
| Spaniards | 47.3 /100 | #175 | Average $60,866 |
| Spanish | 45.5 /100 | #176 | Average $60,795 |
| Alaska Natives | 44.3 /100 | #177 | Average $60,748 |