Zimbabwean vs Northern European Householder Income Over 65 years
COMPARE
Zimbabwean
Northern European
Householder Income Over 65 years
Householder Income Over 65 years Comparison
Zimbabweans
Northern Europeans
$65,854
HOUSEHOLDER INCOME OVER 65 YEARS
99.4/ 100
METRIC RATING
64th/ 347
METRIC RANK
$64,658
HOUSEHOLDER INCOME OVER 65 YEARS
97.9/ 100
METRIC RATING
83rd/ 347
METRIC RANK
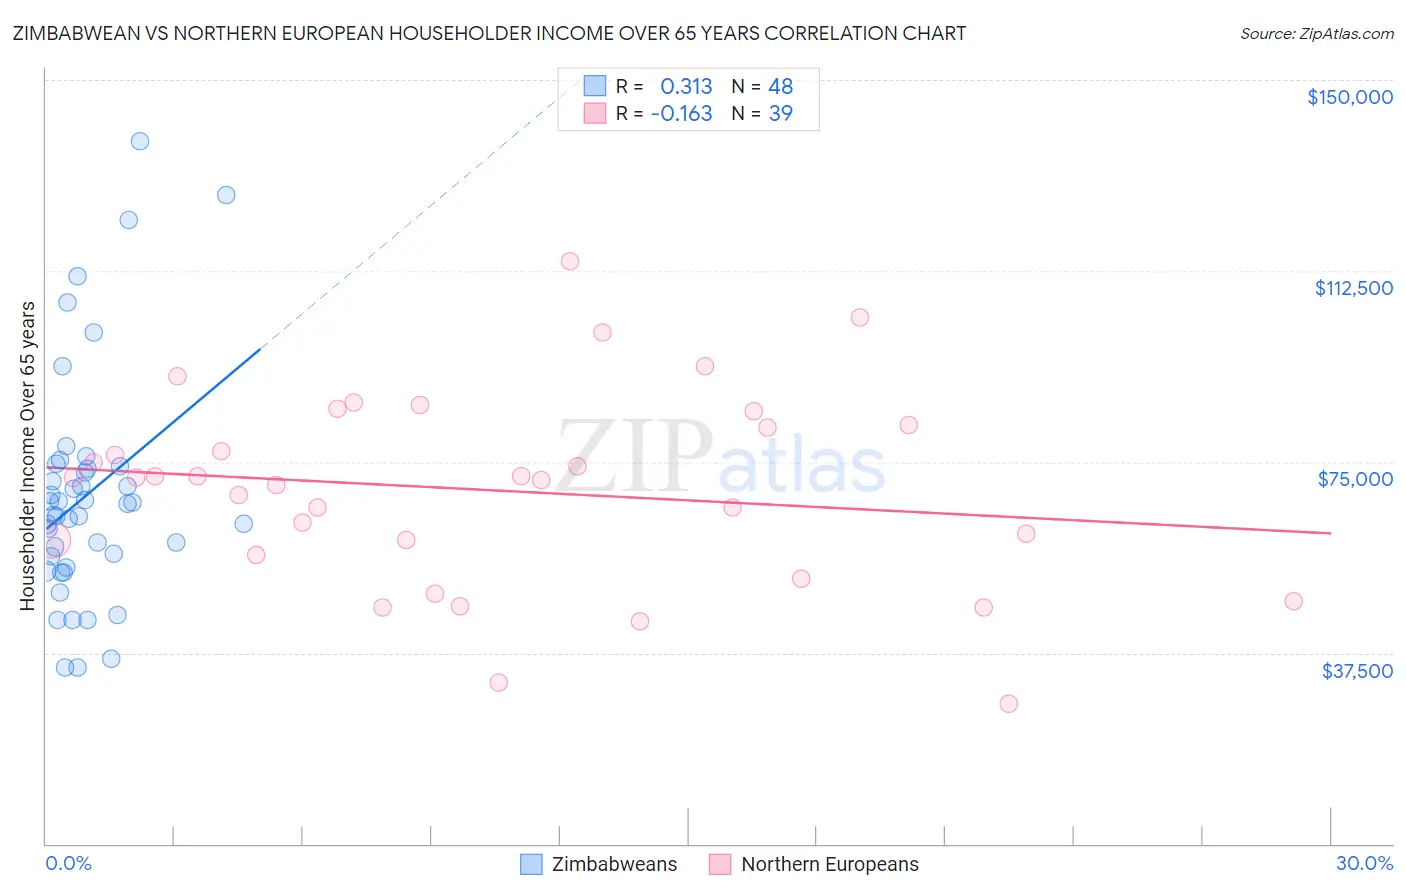
Zimbabwean vs Northern European Householder Income Over 65 years Correlation Chart
The statistical analysis conducted on geographies consisting of 69,104,577 people shows a mild positive correlation between the proportion of Zimbabweans and household income with householder over the age of 65 in the United States with a correlation coefficient (R) of 0.313 and weighted average of $65,854. Similarly, the statistical analysis conducted on geographies consisting of 404,945,292 people shows a poor negative correlation between the proportion of Northern Europeans and household income with householder over the age of 65 in the United States with a correlation coefficient (R) of -0.163 and weighted average of $64,658, a difference of 1.8%.
Householder Income Over 65 years Correlation Summary
| Measurement | Zimbabwean | Northern European |
| Minimum | $34,500 | $27,614 |
| Maximum | $137,885 | $114,286 |
| Range | $103,385 | $86,672 |
| Mean | $68,543 | $69,419 |
| Median | $65,700 | $71,954 |
| Interquartile 25% (IQ1) | $55,350 | $56,705 |
| Interquartile 75% (IQ3) | $73,919 | $82,250 |
| Interquartile Range (IQR) | $18,569 | $25,545 |
| Standard Deviation (Sample) | $22,680 | $19,142 |
| Standard Deviation (Population) | $22,443 | $18,895 |
Demographics Similar to Zimbabweans and Northern Europeans by Householder Income Over 65 years
In terms of householder income over 65 years, the demographic groups most similar to Zimbabweans are Marshallese ($65,874, a difference of 0.030%), Immigrants from England ($65,715, a difference of 0.21%), South African ($65,652, a difference of 0.31%), Immigrants from Malaysia ($65,497, a difference of 0.55%), and Egyptian ($65,441, a difference of 0.63%). Similarly, the demographic groups most similar to Northern Europeans are Immigrants from Fiji ($64,795, a difference of 0.21%), Immigrants from Europe ($64,828, a difference of 0.26%), Immigrants from North America ($64,856, a difference of 0.31%), Hawaiian ($64,920, a difference of 0.40%), and Immigrants from Western Europe ($64,933, a difference of 0.43%).
| Demographics | Rating | Rank | Householder Income Over 65 years |
| Marshallese | 99.4 /100 | #63 | Exceptional $65,874 |
| Zimbabweans | 99.4 /100 | #64 | Exceptional $65,854 |
| Immigrants | England | 99.3 /100 | #65 | Exceptional $65,715 |
| South Africans | 99.3 /100 | #66 | Exceptional $65,652 |
| Immigrants | Malaysia | 99.1 /100 | #67 | Exceptional $65,497 |
| Egyptians | 99.1 /100 | #68 | Exceptional $65,441 |
| Samoans | 99.1 /100 | #69 | Exceptional $65,427 |
| Mongolians | 99.0 /100 | #70 | Exceptional $65,326 |
| Greeks | 98.9 /100 | #71 | Exceptional $65,306 |
| Argentineans | 98.9 /100 | #72 | Exceptional $65,246 |
| Immigrants | Ethiopia | 98.9 /100 | #73 | Exceptional $65,238 |
| Lithuanians | 98.8 /100 | #74 | Exceptional $65,209 |
| Sierra Leoneans | 98.6 /100 | #75 | Exceptional $65,038 |
| Ethiopians | 98.5 /100 | #76 | Exceptional $64,989 |
| Immigrants | Canada | 98.5 /100 | #77 | Exceptional $64,952 |
| Immigrants | Western Europe | 98.5 /100 | #78 | Exceptional $64,933 |
| Hawaiians | 98.4 /100 | #79 | Exceptional $64,920 |
| Immigrants | North America | 98.3 /100 | #80 | Exceptional $64,856 |
| Immigrants | Europe | 98.3 /100 | #81 | Exceptional $64,828 |
| Immigrants | Fiji | 98.2 /100 | #82 | Exceptional $64,795 |
| Northern Europeans | 97.9 /100 | #83 | Exceptional $64,658 |