Immigrants from Asia vs Serbian Householder Income Over 65 years
COMPARE
Immigrants from Asia
Serbian
Householder Income Over 65 years
Householder Income Over 65 years Comparison
Immigrants from Asia
Serbians
$67,594
HOUSEHOLDER INCOME OVER 65 YEARS
99.9/ 100
METRIC RATING
40th/ 347
METRIC RANK
$61,087
HOUSEHOLDER INCOME OVER 65 YEARS
53.1/ 100
METRIC RATING
170th/ 347
METRIC RANK
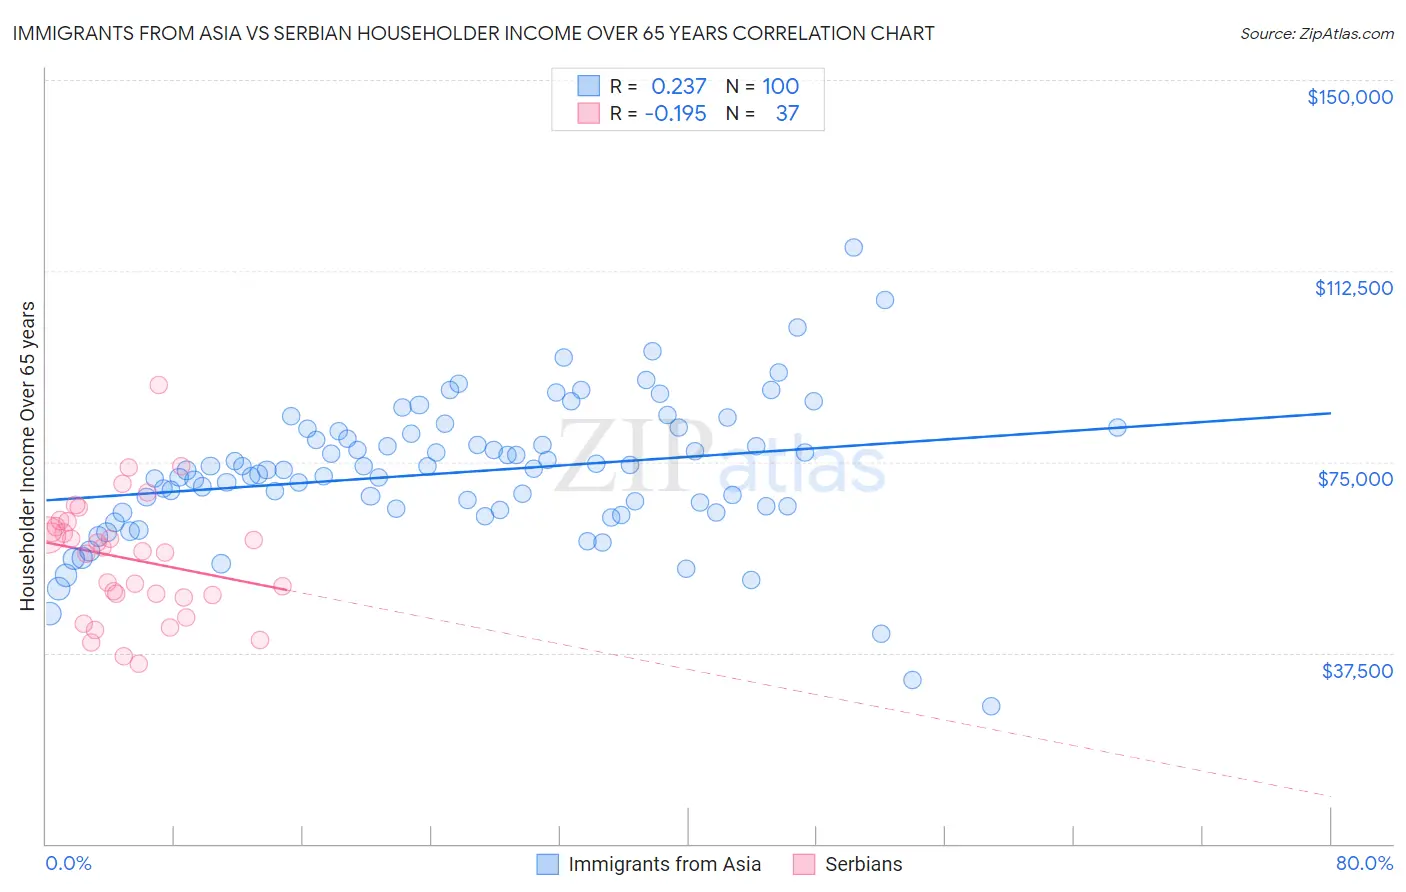
Immigrants from Asia vs Serbian Householder Income Over 65 years Correlation Chart
The statistical analysis conducted on geographies consisting of 545,057,225 people shows a weak positive correlation between the proportion of Immigrants from Asia and household income with householder over the age of 65 in the United States with a correlation coefficient (R) of 0.237 and weighted average of $67,594. Similarly, the statistical analysis conducted on geographies consisting of 267,254,398 people shows a poor negative correlation between the proportion of Serbians and household income with householder over the age of 65 in the United States with a correlation coefficient (R) of -0.195 and weighted average of $61,087, a difference of 10.6%.
Householder Income Over 65 years Correlation Summary
| Measurement | Immigrants from Asia | Serbian |
| Minimum | $26,908 | $35,417 |
| Maximum | $117,045 | $89,997 |
| Range | $90,137 | $54,580 |
| Mean | $72,900 | $56,009 |
| Median | $73,419 | $57,358 |
| Interquartile 25% (IQ1) | $65,605 | $48,698 |
| Interquartile 75% (IQ3) | $80,756 | $62,751 |
| Interquartile Range (IQR) | $15,151 | $14,053 |
| Standard Deviation (Sample) | $13,981 | $11,788 |
| Standard Deviation (Population) | $13,911 | $11,628 |
Similar Demographics by Householder Income Over 65 years
Demographics Similar to Immigrants from Asia by Householder Income Over 65 years
In terms of householder income over 65 years, the demographic groups most similar to Immigrants from Asia are Russian ($67,626, a difference of 0.050%), Korean ($67,472, a difference of 0.18%), New Zealander ($67,333, a difference of 0.39%), Latvian ($67,326, a difference of 0.40%), and Estonian ($67,926, a difference of 0.49%).
| Demographics | Rating | Rank | Householder Income Over 65 years |
| Immigrants | Denmark | 100.0 /100 | #33 | Exceptional $68,801 |
| Immigrants | Ireland | 100.0 /100 | #34 | Exceptional $68,495 |
| Tongans | 100.0 /100 | #35 | Exceptional $68,235 |
| Immigrants | Austria | 99.9 /100 | #36 | Exceptional $68,208 |
| Turks | 99.9 /100 | #37 | Exceptional $68,037 |
| Estonians | 99.9 /100 | #38 | Exceptional $67,926 |
| Russians | 99.9 /100 | #39 | Exceptional $67,626 |
| Immigrants | Asia | 99.9 /100 | #40 | Exceptional $67,594 |
| Koreans | 99.9 /100 | #41 | Exceptional $67,472 |
| New Zealanders | 99.9 /100 | #42 | Exceptional $67,333 |
| Latvians | 99.9 /100 | #43 | Exceptional $67,326 |
| Immigrants | South Africa | 99.9 /100 | #44 | Exceptional $67,234 |
| Immigrants | Afghanistan | 99.8 /100 | #45 | Exceptional $67,007 |
| Cambodians | 99.8 /100 | #46 | Exceptional $66,892 |
| Australians | 99.8 /100 | #47 | Exceptional $66,891 |
Demographics Similar to Serbians by Householder Income Over 65 years
In terms of householder income over 65 years, the demographic groups most similar to Serbians are Carpatho Rusyn ($61,093, a difference of 0.010%), Irish ($61,097, a difference of 0.020%), Norwegian ($61,104, a difference of 0.030%), Inupiat ($61,061, a difference of 0.040%), and Immigrants from Poland ($61,041, a difference of 0.080%).
| Demographics | Rating | Rank | Householder Income Over 65 years |
| Ugandans | 55.5 /100 | #163 | Average $61,177 |
| Immigrants | North Macedonia | 55.4 /100 | #164 | Average $61,175 |
| Immigrants | Ukraine | 55.1 /100 | #165 | Average $61,163 |
| Immigrants | Eastern Africa | 55.0 /100 | #166 | Average $61,157 |
| Norwegians | 53.6 /100 | #167 | Average $61,104 |
| Irish | 53.4 /100 | #168 | Average $61,097 |
| Carpatho Rusyns | 53.3 /100 | #169 | Average $61,093 |
| Serbians | 53.1 /100 | #170 | Average $61,087 |
| Inupiat | 52.4 /100 | #171 | Average $61,061 |
| Immigrants | Poland | 51.9 /100 | #172 | Average $61,041 |
| Immigrants | Micronesia | 50.8 /100 | #173 | Average $61,000 |
| Luxembourgers | 50.0 /100 | #174 | Average $60,967 |
| Spaniards | 47.3 /100 | #175 | Average $60,866 |
| Spanish | 45.5 /100 | #176 | Average $60,795 |
| Alaska Natives | 44.3 /100 | #177 | Average $60,748 |