Zimbabwean vs Immigrants from Belgium Householder Income Under 25 years

COMPARE

Zimbabwean
Race
Ancestry
AfghanAfricanAlaska NativeAlaskan AthabascanAlbanianAleutAlsatianAmericanApacheArabArapahoArgentineanArmenianAssyrian/Chaldean/SyriacAustralianAustrianBahamianBangladeshiBarbadianBasqueBelgianBelizeanBermudanBhutaneseBlackfeetBolivianBrazilianBritishBritish West IndianBulgarianBurmeseCajunCambodianCanadianCape VerdeanCarpatho RusynCelticCentral AmericanCentral American IndianCherokeeCheyenneChickasawChileanChineseChippewaChoctawColombianColvilleComancheCosta RicanCreeCreekCroatianCrowCubanCypriotCzechCzechoslovakianDanishDelawareDominicanDutchDutch West IndianEastern EuropeanEcuadorianEgyptianEnglishEstonianEthiopianEuropeanFijianFilipinoFinnishFrenchFrench American IndianFrench CanadianGermanGerman RussianGhanaianGreekGuamanian/ChamorroGuatemalanGuyaneseHaitianHmongHonduranHopiHoumaHungarianIcelanderIndian (Asian)IndonesianInupiatIranianIraqiIrishIroquoisIsraeliItalianJamaicanJapaneseJordanianKenyanKiowaKoreanLaotianLatvianLebaneseLiberianLithuanianLumbeeLuxembourgerMacedonianMalaysianMalteseMarshalleseMenomineeMexicanMexican American IndianMongolianMoroccanNative HawaiianNavajoNepaleseNew ZealanderNicaraguanNigerianNorthern EuropeanNorwegianOkinawanOsageOttawaPaiutePakistaniPalestinianPanamanianParaguayanPennsylvania GermanPeruvianPimaPolishPortuguesePotawatomiPuebloPuerto RicanPuget Sound SalishRomanianRussianSalvadoranSamoanScandinavianScotch-IrishScottishSeminoleSenegaleseSerbianShoshoneSierra LeoneanSiouxSlavicSlovakSloveneSomaliSouth AfricanSouth AmericanSouth American IndianSoviet UnionSpaniardSpanishSpanish AmericanSpanish American IndianSri LankanSubsaharan AfricanSudaneseSwedishSwissSyrianTaiwaneseThaiTlingit-HaidaTohono O'OdhamTonganTrinidadian and TobagonianTsimshianTurkishU.S. Virgin IslanderUgandanUkrainianUruguayanUteVenezuelanVietnameseWelshWest IndianYakamaYaquiYugoslavianYumanYup'ikZimbabwean
Immigration
NonimmigrantsImmigrantsAfghanistanAfricaAlbaniaArgentinaArmeniaAsiaAustraliaAustriaBahamasBangladeshBarbadosBelarusBelizeBoliviaBosnia and HerzegovinaBrazilBulgariaBurma/MyanmarCabo VerdeCambodiaCameroonCanadaCaribbeanCentral AmericaChileChinaColombiaCongoCosta RicaCroatiaCubaCzechoslovakiaDenmarkDominicaDominican RepublicEastern AfricaEastern AsiaEastern EuropeEcuadorEgyptEl SalvadorEnglandEritreaEthiopiaEuropeFijiFranceGermanyGhanaGreeceGrenadaGuatemalaGuyanaHaitiHondurasHong KongHungaryIndiaIndonesiaIranIraqIrelandIsraelItalyJamaicaJapanJordanKazakhstanKenyaKoreaKuwaitLaosLatin AmericaLatviaLebanonLiberiaLithuaniaMalaysiaMexicoMicronesiaMiddle AfricaMoldovaMoroccoNepalNetherlandsNicaraguaNigeriaNorth AmericaNorth MacedoniaNorthern AfricaNorthern EuropeNorwayOceaniaPakistanPanamaPeruPhilippinesPolandPortugalRomaniaRussiaSaudi ArabiaScotlandSenegalSerbiaSierra LeoneSingaporeSomaliaSouth AfricaSouth AmericaSouth Central AsiaSouth Eastern AsiaSouthern EuropeSpainSri LankaSt. Vincent and the GrenadinesSudanSwedenSwitzerlandSyriaTaiwanThailandTrinidad and TobagoTurkeyUgandaUkraineUruguayUzbekistanVenezuelaVietnamWest IndiesWestern AfricaWestern AsiaWestern EuropeYemenZaireZimbabweAzores
Immigrants from Belgium
Race
Ancestry
AfghanAfricanAlaska NativeAlaskan AthabascanAlbanianAleutAlsatianAmericanApacheArabArapahoArgentineanArmenianAssyrian/Chaldean/SyriacAustralianAustrianBahamianBangladeshiBarbadianBasqueBelgianBelizeanBermudanBhutaneseBlackfeetBolivianBrazilianBritishBritish West IndianBulgarianBurmeseCajunCambodianCanadianCape VerdeanCarpatho RusynCelticCentral AmericanCentral American IndianCherokeeCheyenneChickasawChileanChineseChippewaChoctawColombianColvilleComancheCosta RicanCreeCreekCroatianCrowCubanCypriotCzechCzechoslovakianDanishDelawareDominicanDutchDutch West IndianEastern EuropeanEcuadorianEgyptianEnglishEstonianEthiopianEuropeanFijianFilipinoFinnishFrenchFrench American IndianFrench CanadianGermanGerman RussianGhanaianGreekGuamanian/ChamorroGuatemalanGuyaneseHaitianHmongHonduranHopiHoumaHungarianIcelanderIndian (Asian)IndonesianInupiatIranianIraqiIrishIroquoisIsraeliItalianJamaicanJapaneseJordanianKenyanKiowaKoreanLaotianLatvianLebaneseLiberianLithuanianLumbeeLuxembourgerMacedonianMalaysianMalteseMarshalleseMenomineeMexicanMexican American IndianMongolianMoroccanNative HawaiianNavajoNepaleseNew ZealanderNicaraguanNigerianNorthern EuropeanNorwegianOkinawanOsageOttawaPaiutePakistaniPalestinianPanamanianParaguayanPennsylvania GermanPeruvianPimaPolishPortuguesePotawatomiPuebloPuerto RicanPuget Sound SalishRomanianRussianSalvadoranSamoanScandinavianScotch-IrishScottishSeminoleSenegaleseSerbianShoshoneSierra LeoneanSiouxSlavicSlovakSloveneSomaliSouth AfricanSouth AmericanSouth American IndianSoviet UnionSpaniardSpanishSpanish AmericanSpanish American IndianSri LankanSubsaharan AfricanSudaneseSwedishSwissSyrianTaiwaneseThaiTlingit-HaidaTohono O'OdhamTonganTrinidadian and TobagonianTsimshianTurkishU.S. Virgin IslanderUgandanUkrainianUruguayanUteVenezuelanVietnameseWelshWest IndianYakamaYaquiYugoslavianYumanYup'ik
Immigration
NonimmigrantsImmigrantsAfghanistanAfricaAlbaniaArgentinaArmeniaAsiaAustraliaAustriaBahamasBangladeshBarbadosBelarusBelgiumBelizeBoliviaBosnia and HerzegovinaBrazilBulgariaBurma/MyanmarCabo VerdeCambodiaCameroonCanadaCaribbeanCentral AmericaChileChinaColombiaCongoCosta RicaCroatiaCubaCzechoslovakiaDenmarkDominicaDominican RepublicEastern AfricaEastern AsiaEastern EuropeEcuadorEgyptEl SalvadorEnglandEritreaEthiopiaEuropeFijiFranceGermanyGhanaGreeceGrenadaGuatemalaGuyanaHaitiHondurasHong KongHungaryIndiaIndonesiaIranIraqIrelandIsraelItalyJamaicaJapanJordanKazakhstanKenyaKoreaKuwaitLaosLatin AmericaLatviaLebanonLiberiaLithuaniaMalaysiaMexicoMicronesiaMiddle AfricaMoldovaMoroccoNepalNetherlandsNicaraguaNigeriaNorth AmericaNorth MacedoniaNorthern AfricaNorthern EuropeNorwayOceaniaPakistanPanamaPeruPhilippinesPolandPortugalRomaniaRussiaSaudi ArabiaScotlandSenegalSerbiaSierra LeoneSingaporeSomaliaSouth AfricaSouth AmericaSouth Central AsiaSouth Eastern AsiaSouthern EuropeSpainSri LankaSt. Vincent and the GrenadinesSudanSwedenSwitzerlandSyriaTaiwanThailandTrinidad and TobagoTurkeyUgandaUkraineUruguayUzbekistanVenezuelaVietnamWest IndiesWestern AfricaWestern AsiaWestern EuropeYemenZaireZimbabweAzores
Householder Income Under 25 years
Income
Poverty
Unemployment
Labor Participation
Family Structure
Vehicle Availability
Education Level
Disability

Householder Income Under 25 years Comparison

Zimbabweans

Immigrants from Belgium

Tragic
Exceptional
$51,259
HOUSEHOLDER INCOME UNDER 25 YEARS
9.3/ 100
METRIC RATING
214th/ 347
METRIC RANK
$54,830
HOUSEHOLDER INCOME UNDER 25 YEARS
99.8/ 100
METRIC RATING
63rd/ 347
METRIC RANK

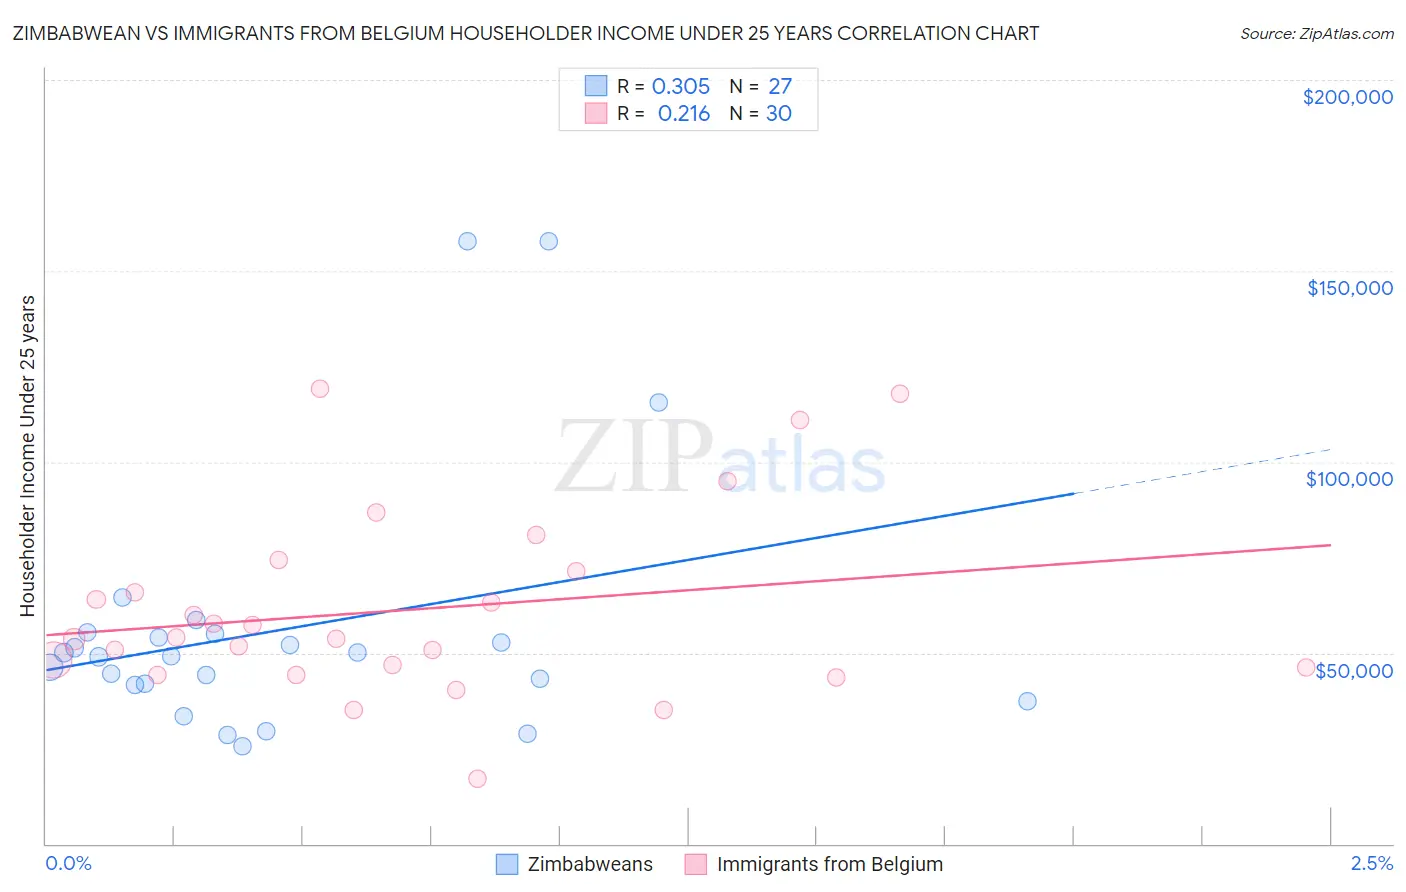
Zimbabwean vs Immigrants from Belgium Householder Income Under 25 years Correlation Chart

The statistical analysis conducted on geographies consisting of 66,344,715 people shows a mild positive correlation between the proportion of Zimbabweans and household income with householder under the age of 25 in the United States with a correlation coefficient (R) of 0.305 and weighted average of $51,259. Similarly, the statistical analysis conducted on geographies consisting of 131,972,517 people shows a weak positive correlation between the proportion of Immigrants from Belgium and household income with householder under the age of 25 in the United States with a correlation coefficient (R) of 0.216 and weighted average of $54,830, a difference of 7.0%.
Zimbabwean vs Immigrants from Belgium Householder Income Under 25 years

Householder Income Under 25 years Correlation Summary

MeasurementZimbabweanImmigrants from Belgium
Minimum$25,388$17,103
Maximum$157,810$119,035
Range$132,422$101,933
Mean$56,178$61,275
Median$48,971$53,928
Interquartile 25% (IQ1)$41,511$46,000
Interquartile 75% (IQ3)$55,000$71,485
Interquartile Range (IQR)$13,489$25,485
Standard Deviation (Sample)$33,671$24,412
Standard Deviation (Population)$33,042$24,002

Similar Demographics by Householder Income Under 25 years

Demographics Similar to Zimbabweans by Householder Income Under 25 years

In terms of householder income under 25 years, the demographic groups most similar to Zimbabweans are Dutch ($51,265, a difference of 0.010%), Icelander ($51,247, a difference of 0.020%), Immigrants from Panama ($51,278, a difference of 0.040%), French ($51,230, a difference of 0.060%), and Czechoslovakian ($51,224, a difference of 0.070%).
DemographicsRating | RankHouseholder Income Under 25 years
South Africans
12.2
/100
|
#207
Poor
$51,383
Immigrants | Jordan
11.9
/100
|
#208
Poor
$51,370
Syrians
11.4
/100
|
#209
Poor
$51,353
Immigrants | Ghana
10.9
/100
|
#210
Poor
$51,333
Irish
10.6
/100
|
#211
Poor
$51,317
Immigrants | Panama
9.7
/100
|
#212
Tragic
$51,278
Dutch
9.4
/100
|
#213
Tragic
$51,265
Zimbabweans
9.3
/100
|
#214
Tragic
$51,259
Icelanders
9.1
/100
|
#215
Tragic
$51,247
French
8.7
/100
|
#216
Tragic
$51,230
Czechoslovakians
8.6
/100
|
#217
Tragic
$51,224
Immigrants | Belize
8.6
/100
|
#218
Tragic
$51,223
Arabs
8.5
/100
|
#219
Tragic
$51,219
Immigrants | Germany
8.0
/100
|
#220
Tragic
$51,190
Immigrants | Eastern Africa
7.4
/100
|
#221
Tragic
$51,158

Demographics Similar to Immigrants from Belgium by Householder Income Under 25 years

In terms of householder income under 25 years, the demographic groups most similar to Immigrants from Belgium are Immigrants from Uzbekistan ($54,846, a difference of 0.030%), Burmese ($54,800, a difference of 0.060%), Yup'ik ($54,732, a difference of 0.18%), Immigrants from Bangladesh ($54,714, a difference of 0.21%), and Okinawan ($54,701, a difference of 0.24%).
DemographicsRating | RankHouseholder Income Under 25 years
Salvadorans
100.0
/100
|
#56
Exceptional
$55,412
Soviet Union
100.0
/100
|
#57
Exceptional
$55,340
Guyanese
99.9
/100
|
#58
Exceptional
$55,210
Native Hawaiians
99.9
/100
|
#59
Exceptional
$55,158
Immigrants | Lithuania
99.9
/100
|
#60
Exceptional
$55,028
Immigrants | Europe
99.9
/100
|
#61
Exceptional
$55,022
Immigrants | Uzbekistan
99.8
/100
|
#62
Exceptional
$54,846
Immigrants | Belgium
99.8
/100
|
#63
Exceptional
$54,830
Burmese
99.8
/100
|
#64
Exceptional
$54,800
Yup'ik
99.8
/100
|
#65
Exceptional
$54,732
Immigrants | Bangladesh
99.8
/100
|
#66
Exceptional
$54,714
Okinawans
99.8
/100
|
#67
Exceptional
$54,701
Tsimshian
99.8
/100
|
#68
Exceptional
$54,649
Samoans
99.7
/100
|
#69
Exceptional
$54,610
Immigrants | El Salvador
99.7
/100
|
#70
Exceptional
$54,599