Yugoslavian vs Immigrants from South Eastern Asia Householder Income Under 25 years
COMPARE
Yugoslavian
Immigrants from South Eastern Asia
Householder Income Under 25 years
Householder Income Under 25 years Comparison
Yugoslavians
Immigrants from South Eastern Asia
$51,028
HOUSEHOLDER INCOME UNDER 25 YEARS
5.5/ 100
METRIC RATING
226th/ 347
METRIC RANK
$55,714
HOUSEHOLDER INCOME UNDER 25 YEARS
100.0/ 100
METRIC RATING
43rd/ 347
METRIC RANK
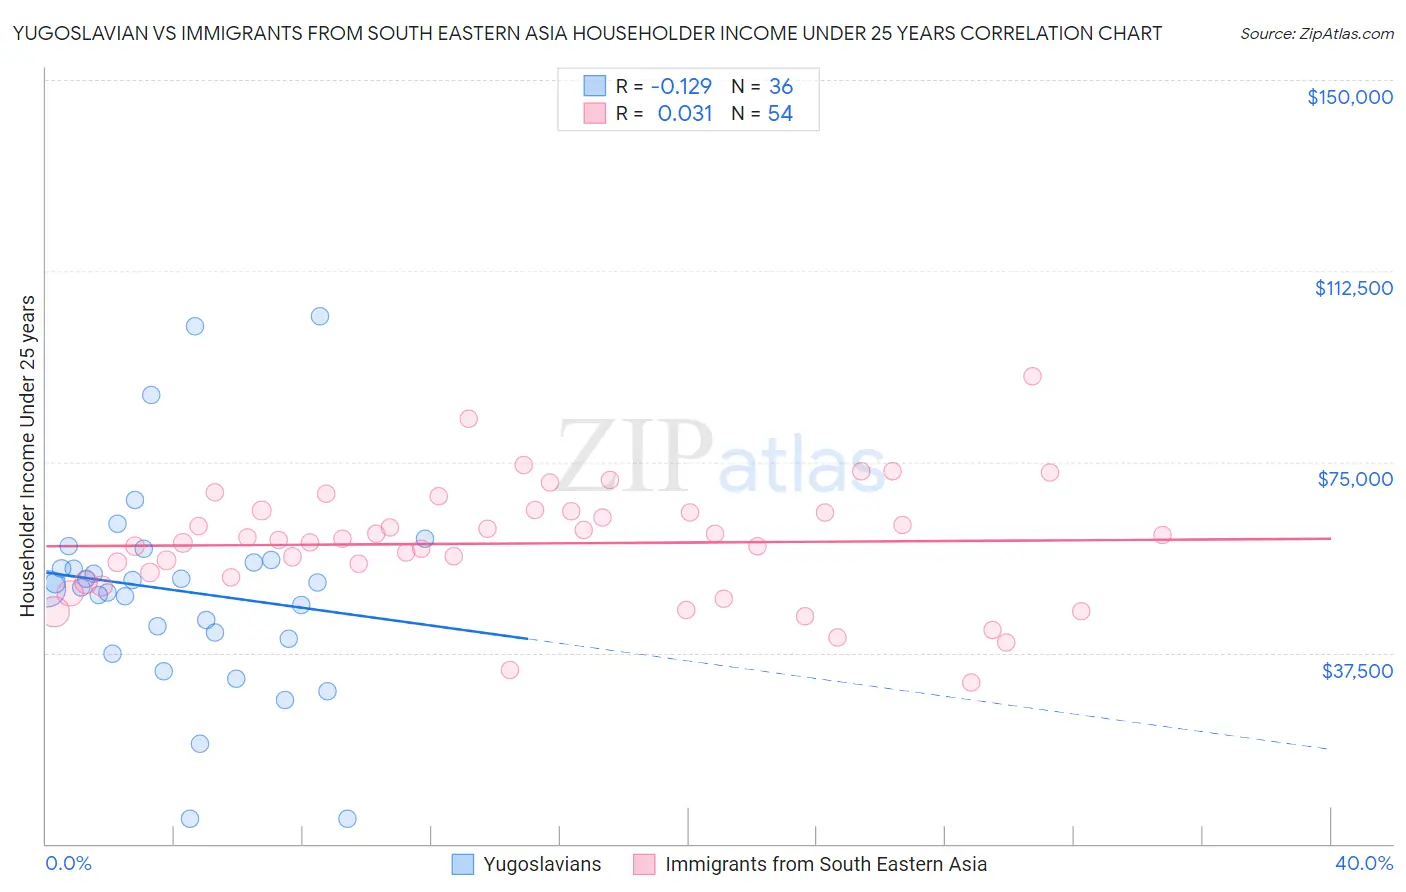
Yugoslavian vs Immigrants from South Eastern Asia Householder Income Under 25 years Correlation Chart
The statistical analysis conducted on geographies consisting of 250,106,142 people shows a poor negative correlation between the proportion of Yugoslavians and household income with householder under the age of 25 in the United States with a correlation coefficient (R) of -0.129 and weighted average of $51,028. Similarly, the statistical analysis conducted on geographies consisting of 413,516,048 people shows no correlation between the proportion of Immigrants from South Eastern Asia and household income with householder under the age of 25 in the United States with a correlation coefficient (R) of 0.031 and weighted average of $55,714, a difference of 9.2%.
Householder Income Under 25 years Correlation Summary
| Measurement | Yugoslavian | Immigrants from South Eastern Asia |
| Minimum | $4,881 | $31,667 |
| Maximum | $103,500 | $91,771 |
| Range | $98,619 | $60,104 |
| Mean | $49,574 | $58,961 |
| Median | $50,803 | $59,717 |
| Interquartile 25% (IQ1) | $40,912 | $52,347 |
| Interquartile 75% (IQ3) | $55,573 | $65,355 |
| Interquartile Range (IQR) | $14,662 | $13,008 |
| Standard Deviation (Sample) | $20,475 | $11,452 |
| Standard Deviation (Population) | $20,189 | $11,346 |
Similar Demographics by Householder Income Under 25 years
Demographics Similar to Yugoslavians by Householder Income Under 25 years
In terms of householder income under 25 years, the demographic groups most similar to Yugoslavians are Immigrants from Central America ($51,022, a difference of 0.010%), Immigrants from Jamaica ($51,038, a difference of 0.020%), Immigrants from Norway ($50,984, a difference of 0.090%), Belizean ($51,094, a difference of 0.13%), and Serbian ($51,106, a difference of 0.15%).
| Demographics | Rating | Rank | Householder Income Under 25 years |
| Arabs | 8.5 /100 | #219 | Tragic $51,219 |
| Immigrants | Germany | 8.0 /100 | #220 | Tragic $51,190 |
| Immigrants | Eastern Africa | 7.4 /100 | #221 | Tragic $51,158 |
| Spaniards | 6.8 /100 | #222 | Tragic $51,117 |
| Serbians | 6.6 /100 | #223 | Tragic $51,106 |
| Belizeans | 6.4 /100 | #224 | Tragic $51,094 |
| Immigrants | Jamaica | 5.6 /100 | #225 | Tragic $51,038 |
| Yugoslavians | 5.5 /100 | #226 | Tragic $51,028 |
| Immigrants | Central America | 5.4 /100 | #227 | Tragic $51,022 |
| Immigrants | Norway | 5.0 /100 | #228 | Tragic $50,984 |
| Yuman | 4.4 /100 | #229 | Tragic $50,933 |
| Jamaicans | 4.4 /100 | #230 | Tragic $50,929 |
| Ugandans | 4.3 /100 | #231 | Tragic $50,923 |
| Slovenes | 4.0 /100 | #232 | Tragic $50,886 |
| Pennsylvania Germans | 3.7 /100 | #233 | Tragic $50,852 |
Demographics Similar to Immigrants from South Eastern Asia by Householder Income Under 25 years
In terms of householder income under 25 years, the demographic groups most similar to Immigrants from South Eastern Asia are Immigrants from Korea ($55,716, a difference of 0.0%), Immigrants from Greece ($55,727, a difference of 0.020%), Immigrants from Guyana ($55,726, a difference of 0.020%), Immigrants from Belarus ($55,743, a difference of 0.050%), and Paraguayan ($55,614, a difference of 0.18%).
| Demographics | Rating | Rank | Householder Income Under 25 years |
| Immigrants | Israel | 100.0 /100 | #36 | Exceptional $55,913 |
| Immigrants | Russia | 100.0 /100 | #37 | Exceptional $55,891 |
| Immigrants | Iran | 100.0 /100 | #38 | Exceptional $55,880 |
| Immigrants | Belarus | 100.0 /100 | #39 | Exceptional $55,743 |
| Immigrants | Greece | 100.0 /100 | #40 | Exceptional $55,727 |
| Immigrants | Guyana | 100.0 /100 | #41 | Exceptional $55,726 |
| Immigrants | Korea | 100.0 /100 | #42 | Exceptional $55,716 |
| Immigrants | South Eastern Asia | 100.0 /100 | #43 | Exceptional $55,714 |
| Paraguayans | 100.0 /100 | #44 | Exceptional $55,614 |
| Spanish American Indians | 100.0 /100 | #45 | Exceptional $55,573 |
| Immigrants | Eastern Europe | 100.0 /100 | #46 | Exceptional $55,572 |
| Cambodians | 100.0 /100 | #47 | Exceptional $55,571 |
| Immigrants | Vietnam | 100.0 /100 | #48 | Exceptional $55,562 |
| Iranians | 100.0 /100 | #49 | Exceptional $55,548 |
| Puget Sound Salish | 100.0 /100 | #50 | Exceptional $55,543 |