Nepalese vs Immigrants from South Eastern Asia Householder Income Under 25 years
COMPARE
Nepalese
Immigrants from South Eastern Asia
Householder Income Under 25 years
Householder Income Under 25 years Comparison
Nepalese
Immigrants from South Eastern Asia
$54,472
HOUSEHOLDER INCOME UNDER 25 YEARS
99.6/ 100
METRIC RATING
78th/ 347
METRIC RANK
$55,714
HOUSEHOLDER INCOME UNDER 25 YEARS
100.0/ 100
METRIC RATING
43rd/ 347
METRIC RANK
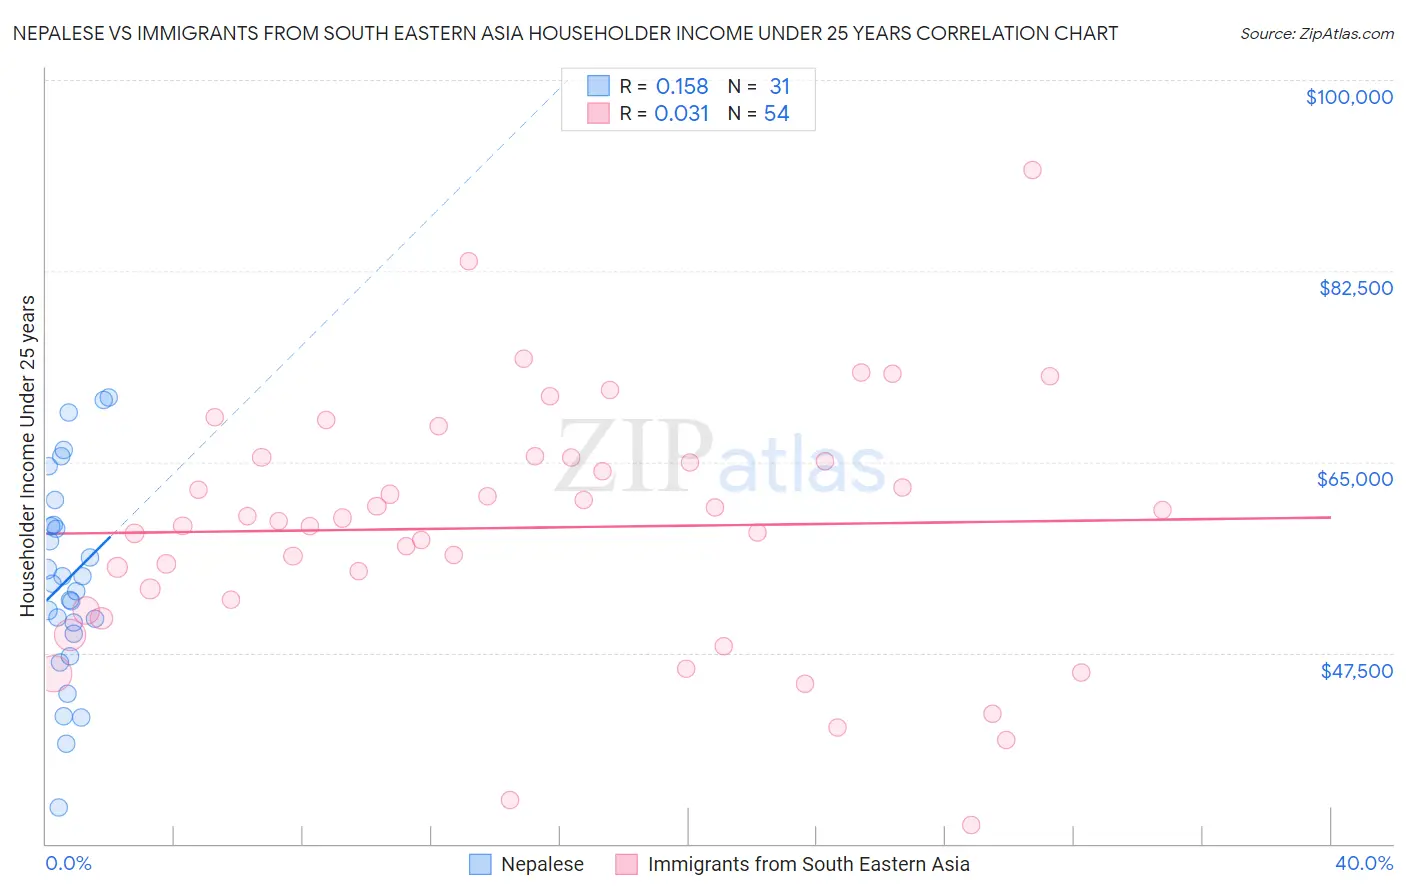
Nepalese vs Immigrants from South Eastern Asia Householder Income Under 25 years Correlation Chart
The statistical analysis conducted on geographies consisting of 22,881,746 people shows a poor positive correlation between the proportion of Nepalese and household income with householder under the age of 25 in the United States with a correlation coefficient (R) of 0.158 and weighted average of $54,472. Similarly, the statistical analysis conducted on geographies consisting of 413,516,048 people shows no correlation between the proportion of Immigrants from South Eastern Asia and household income with householder under the age of 25 in the United States with a correlation coefficient (R) of 0.031 and weighted average of $55,714, a difference of 2.3%.
Householder Income Under 25 years Correlation Summary
| Measurement | Nepalese | Immigrants from South Eastern Asia |
| Minimum | $33,325 | $31,667 |
| Maximum | $70,914 | $91,771 |
| Range | $37,589 | $60,104 |
| Mean | $54,229 | $58,961 |
| Median | $53,846 | $59,717 |
| Interquartile 25% (IQ1) | $49,219 | $52,347 |
| Interquartile 75% (IQ3) | $59,177 | $65,355 |
| Interquartile Range (IQR) | $9,958 | $13,008 |
| Standard Deviation (Sample) | $9,280 | $11,452 |
| Standard Deviation (Population) | $9,129 | $11,346 |
Similar Demographics by Householder Income Under 25 years
Demographics Similar to Nepalese by Householder Income Under 25 years
In terms of householder income under 25 years, the demographic groups most similar to Nepalese are Immigrants from Southern Europe ($54,484, a difference of 0.020%), Immigrants from Brazil ($54,487, a difference of 0.030%), Immigrants from Italy ($54,449, a difference of 0.040%), Egyptian ($54,444, a difference of 0.050%), and Portuguese ($54,436, a difference of 0.060%).
| Demographics | Rating | Rank | Householder Income Under 25 years |
| Immigrants | Morocco | 99.7 /100 | #71 | Exceptional $54,593 |
| Immigrants | Northern Europe | 99.7 /100 | #72 | Exceptional $54,571 |
| Macedonians | 99.7 /100 | #73 | Exceptional $54,563 |
| Immigrants | Grenada | 99.7 /100 | #74 | Exceptional $54,538 |
| Immigrants | Sri Lanka | 99.7 /100 | #75 | Exceptional $54,512 |
| Immigrants | Brazil | 99.6 /100 | #76 | Exceptional $54,487 |
| Immigrants | Southern Europe | 99.6 /100 | #77 | Exceptional $54,484 |
| Nepalese | 99.6 /100 | #78 | Exceptional $54,472 |
| Immigrants | Italy | 99.6 /100 | #79 | Exceptional $54,449 |
| Egyptians | 99.6 /100 | #80 | Exceptional $54,444 |
| Portuguese | 99.6 /100 | #81 | Exceptional $54,436 |
| Russians | 99.5 /100 | #82 | Exceptional $54,389 |
| Laotians | 99.5 /100 | #83 | Exceptional $54,369 |
| Bulgarians | 99.5 /100 | #84 | Exceptional $54,352 |
| Immigrants | Czechoslovakia | 99.5 /100 | #85 | Exceptional $54,352 |
Demographics Similar to Immigrants from South Eastern Asia by Householder Income Under 25 years
In terms of householder income under 25 years, the demographic groups most similar to Immigrants from South Eastern Asia are Immigrants from Korea ($55,716, a difference of 0.0%), Immigrants from Greece ($55,727, a difference of 0.020%), Immigrants from Guyana ($55,726, a difference of 0.020%), Immigrants from Belarus ($55,743, a difference of 0.050%), and Paraguayan ($55,614, a difference of 0.18%).
| Demographics | Rating | Rank | Householder Income Under 25 years |
| Immigrants | Israel | 100.0 /100 | #36 | Exceptional $55,913 |
| Immigrants | Russia | 100.0 /100 | #37 | Exceptional $55,891 |
| Immigrants | Iran | 100.0 /100 | #38 | Exceptional $55,880 |
| Immigrants | Belarus | 100.0 /100 | #39 | Exceptional $55,743 |
| Immigrants | Greece | 100.0 /100 | #40 | Exceptional $55,727 |
| Immigrants | Guyana | 100.0 /100 | #41 | Exceptional $55,726 |
| Immigrants | Korea | 100.0 /100 | #42 | Exceptional $55,716 |
| Immigrants | South Eastern Asia | 100.0 /100 | #43 | Exceptional $55,714 |
| Paraguayans | 100.0 /100 | #44 | Exceptional $55,614 |
| Spanish American Indians | 100.0 /100 | #45 | Exceptional $55,573 |
| Immigrants | Eastern Europe | 100.0 /100 | #46 | Exceptional $55,572 |
| Cambodians | 100.0 /100 | #47 | Exceptional $55,571 |
| Immigrants | Vietnam | 100.0 /100 | #48 | Exceptional $55,562 |
| Iranians | 100.0 /100 | #49 | Exceptional $55,548 |
| Puget Sound Salish | 100.0 /100 | #50 | Exceptional $55,543 |