Immigrants from Indonesia vs Immigrants from South Eastern Asia Householder Income Under 25 years

COMPARE

Immigrants from Indonesia
Race
Ancestry
AfghanAfricanAlaska NativeAlaskan AthabascanAlbanianAleutAlsatianAmericanApacheArabArapahoArgentineanArmenianAssyrian/Chaldean/SyriacAustralianAustrianBahamianBangladeshiBarbadianBasqueBelgianBelizeanBermudanBhutaneseBlackfeetBolivianBrazilianBritishBritish West IndianBulgarianBurmeseCajunCambodianCanadianCape VerdeanCarpatho RusynCelticCentral AmericanCentral American IndianCherokeeCheyenneChickasawChileanChineseChippewaChoctawColombianColvilleComancheCosta RicanCreeCreekCroatianCrowCubanCypriotCzechCzechoslovakianDanishDelawareDominicanDutchDutch West IndianEastern EuropeanEcuadorianEgyptianEnglishEstonianEthiopianEuropeanFijianFilipinoFinnishFrenchFrench American IndianFrench CanadianGermanGerman RussianGhanaianGreekGuamanian/ChamorroGuatemalanGuyaneseHaitianHmongHonduranHopiHoumaHungarianIcelanderIndian (Asian)IndonesianInupiatIranianIraqiIrishIroquoisIsraeliItalianJamaicanJapaneseJordanianKenyanKiowaKoreanLaotianLatvianLebaneseLiberianLithuanianLumbeeLuxembourgerMacedonianMalaysianMalteseMarshalleseMenomineeMexicanMexican American IndianMongolianMoroccanNative HawaiianNavajoNepaleseNew ZealanderNicaraguanNigerianNorthern EuropeanNorwegianOkinawanOsageOttawaPaiutePakistaniPalestinianPanamanianParaguayanPennsylvania GermanPeruvianPimaPolishPortuguesePotawatomiPuebloPuerto RicanPuget Sound SalishRomanianRussianSalvadoranSamoanScandinavianScotch-IrishScottishSeminoleSenegaleseSerbianShoshoneSierra LeoneanSiouxSlavicSlovakSloveneSomaliSouth AfricanSouth AmericanSouth American IndianSoviet UnionSpaniardSpanishSpanish AmericanSpanish American IndianSri LankanSubsaharan AfricanSudaneseSwedishSwissSyrianTaiwaneseThaiTlingit-HaidaTohono O'OdhamTonganTrinidadian and TobagonianTsimshianTurkishU.S. Virgin IslanderUgandanUkrainianUruguayanUteVenezuelanVietnameseWelshWest IndianYakamaYaquiYugoslavianYumanYup'ikZimbabwean
Immigration
NonimmigrantsImmigrantsAfghanistanAfricaAlbaniaArgentinaArmeniaAsiaAustraliaAustriaBahamasBangladeshBarbadosBelarusBelgiumBelizeBoliviaBosnia and HerzegovinaBrazilBulgariaBurma/MyanmarCabo VerdeCambodiaCameroonCanadaCaribbeanCentral AmericaChileChinaColombiaCongoCosta RicaCroatiaCubaCzechoslovakiaDenmarkDominicaDominican RepublicEastern AfricaEastern AsiaEastern EuropeEcuadorEgyptEl SalvadorEnglandEritreaEthiopiaEuropeFijiFranceGermanyGhanaGreeceGrenadaGuatemalaGuyanaHaitiHondurasHong KongHungaryIndiaIndonesiaIranIraqIrelandIsraelItalyJamaicaJapanJordanKazakhstanKenyaKoreaKuwaitLaosLatin AmericaLatviaLebanonLiberiaLithuaniaMalaysiaMexicoMicronesiaMiddle AfricaMoldovaMoroccoNepalNetherlandsNicaraguaNigeriaNorth AmericaNorth MacedoniaNorthern AfricaNorthern EuropeNorwayOceaniaPakistanPanamaPeruPhilippinesPolandPortugalRomaniaRussiaSaudi ArabiaScotlandSenegalSerbiaSierra LeoneSingaporeSomaliaSouth AfricaSouth AmericaSouth Central AsiaSouthern EuropeSpainSri LankaSt. Vincent and the GrenadinesSudanSwedenSwitzerlandSyriaTaiwanThailandTrinidad and TobagoTurkeyUgandaUkraineUruguayUzbekistanVenezuelaVietnamWest IndiesWestern AfricaWestern AsiaWestern EuropeYemenZaireZimbabweAzores
Immigrants from South Eastern Asia
Race
Ancestry
AfghanAfricanAlaska NativeAlaskan AthabascanAlbanianAleutAlsatianAmericanApacheArabArapahoArgentineanArmenianAssyrian/Chaldean/SyriacAustralianAustrianBahamianBangladeshiBarbadianBasqueBelgianBelizeanBermudanBhutaneseBlackfeetBolivianBrazilianBritishBritish West IndianBulgarianBurmeseCajunCambodianCanadianCape VerdeanCarpatho RusynCelticCentral AmericanCentral American IndianCherokeeCheyenneChickasawChileanChineseChippewaChoctawColombianColvilleComancheCosta RicanCreeCreekCroatianCrowCubanCypriotCzechCzechoslovakianDanishDelawareDominicanDutchDutch West IndianEastern EuropeanEcuadorianEgyptianEnglishEstonianEthiopianEuropeanFijianFilipinoFinnishFrenchFrench American IndianFrench CanadianGermanGerman RussianGhanaianGreekGuamanian/ChamorroGuatemalanGuyaneseHaitianHmongHonduranHopiHoumaHungarianIcelanderIndian (Asian)IndonesianInupiatIranianIraqiIrishIroquoisIsraeliItalianJamaicanJapaneseJordanianKenyanKiowaKoreanLaotianLatvianLebaneseLiberianLithuanianLumbeeLuxembourgerMacedonianMalaysianMalteseMarshalleseMenomineeMexicanMexican American IndianMongolianMoroccanNative HawaiianNavajoNepaleseNew ZealanderNicaraguanNigerianNorthern EuropeanNorwegianOkinawanOsageOttawaPaiutePakistaniPalestinianPanamanianParaguayanPennsylvania GermanPeruvianPimaPolishPortuguesePotawatomiPuebloPuerto RicanPuget Sound SalishRomanianRussianSalvadoranSamoanScandinavianScotch-IrishScottishSeminoleSenegaleseSerbianShoshoneSierra LeoneanSiouxSlavicSlovakSloveneSomaliSouth AfricanSouth AmericanSouth American IndianSoviet UnionSpaniardSpanishSpanish AmericanSpanish American IndianSri LankanSubsaharan AfricanSudaneseSwedishSwissSyrianTaiwaneseThaiTlingit-HaidaTohono O'OdhamTonganTrinidadian and TobagonianTsimshianTurkishU.S. Virgin IslanderUgandanUkrainianUruguayanUteVenezuelanVietnameseWelshWest IndianYakamaYaquiYugoslavianYumanYup'ikZimbabwean
Immigration
NonimmigrantsImmigrantsAfghanistanAfricaAlbaniaArgentinaArmeniaAsiaAustraliaAustriaBahamasBangladeshBarbadosBelarusBelgiumBelizeBoliviaBosnia and HerzegovinaBrazilBulgariaBurma/MyanmarCabo VerdeCambodiaCameroonCanadaCaribbeanCentral AmericaChileChinaColombiaCongoCosta RicaCroatiaCubaCzechoslovakiaDenmarkDominicaDominican RepublicEastern AfricaEastern AsiaEastern EuropeEcuadorEgyptEl SalvadorEnglandEritreaEthiopiaEuropeFijiFranceGermanyGhanaGreeceGrenadaGuatemalaGuyanaHaitiHondurasHong KongHungaryIndiaIranIraqIrelandIsraelItalyJamaicaJapanJordanKazakhstanKenyaKoreaKuwaitLaosLatin AmericaLatviaLebanonLiberiaLithuaniaMalaysiaMexicoMicronesiaMiddle AfricaMoldovaMoroccoNepalNetherlandsNicaraguaNigeriaNorth AmericaNorth MacedoniaNorthern AfricaNorthern EuropeNorwayOceaniaPakistanPanamaPeruPhilippinesPolandPortugalRomaniaRussiaSaudi ArabiaScotlandSenegalSerbiaSierra LeoneSingaporeSomaliaSouth AfricaSouth AmericaSouth Central AsiaSouth Eastern AsiaSouthern EuropeSpainSri LankaSt. Vincent and the GrenadinesSudanSwedenSwitzerlandSyriaTaiwanThailandTrinidad and TobagoTurkeyUgandaUkraineUruguayUzbekistanVenezuelaVietnamWest IndiesWestern AfricaWestern AsiaWestern EuropeYemenZaireZimbabweAzores
Householder Income Under 25 years
Income
Poverty
Unemployment
Labor Participation
Family Structure
Vehicle Availability
Education Level
Disability

Householder Income Under 25 years Comparison

Immigrants from Indonesia

Immigrants from South Eastern Asia

Exceptional
Exceptional
$55,521
HOUSEHOLDER INCOME UNDER 25 YEARS
100.0/ 100
METRIC RATING
52nd/ 347
METRIC RANK
$55,714
HOUSEHOLDER INCOME UNDER 25 YEARS
100.0/ 100
METRIC RATING
43rd/ 347
METRIC RANK

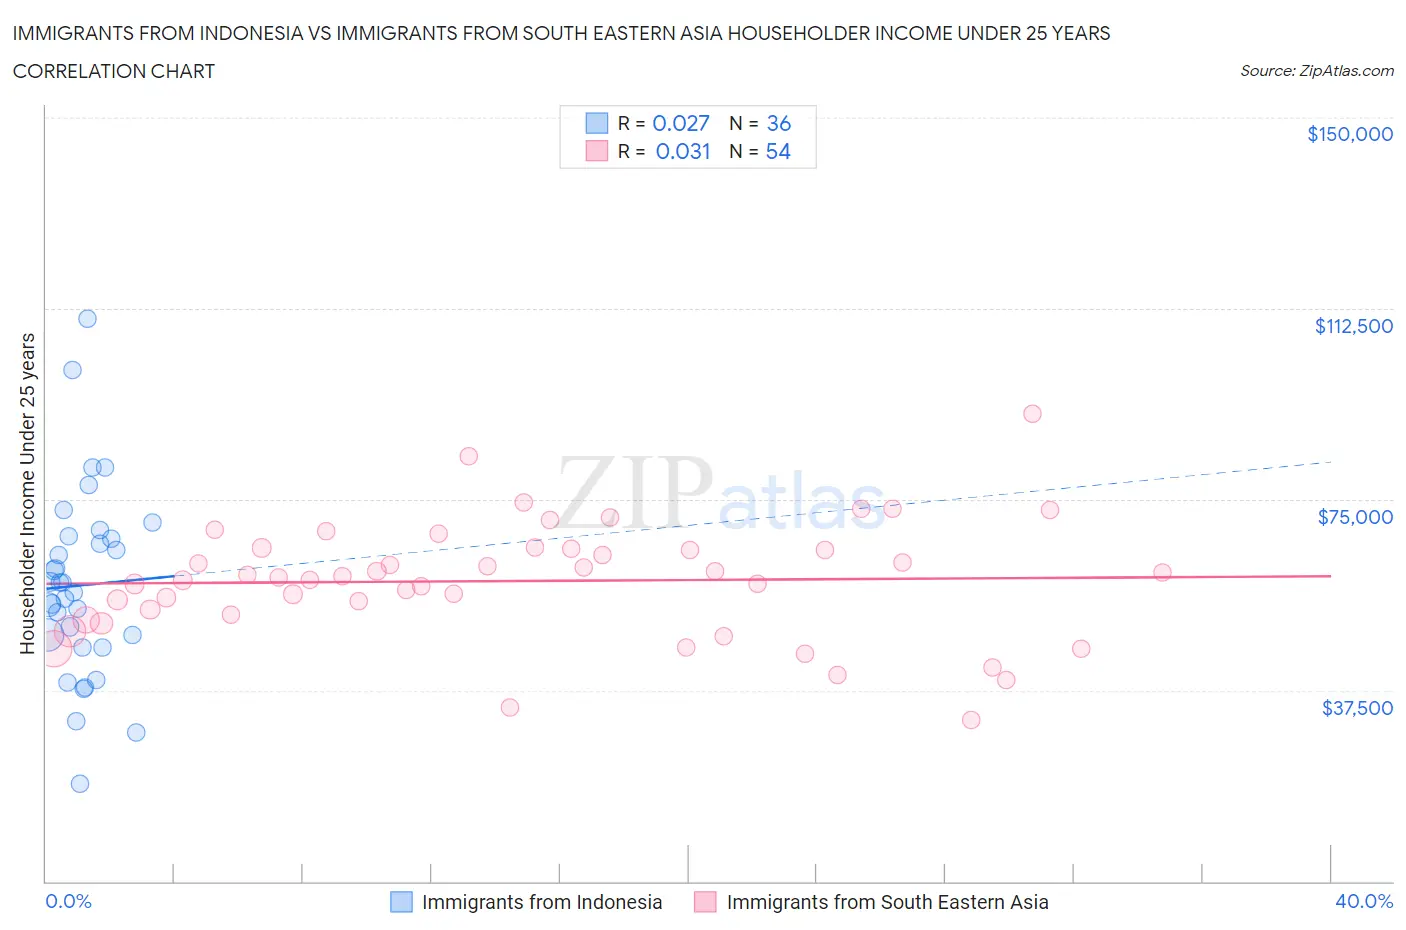
Immigrants from Indonesia vs Immigrants from South Eastern Asia Householder Income Under 25 years Correlation Chart

The statistical analysis conducted on geographies consisting of 192,704,558 people shows no correlation between the proportion of Immigrants from Indonesia and household income with householder under the age of 25 in the United States with a correlation coefficient (R) of 0.027 and weighted average of $55,521. Similarly, the statistical analysis conducted on geographies consisting of 413,516,048 people shows no correlation between the proportion of Immigrants from South Eastern Asia and household income with householder under the age of 25 in the United States with a correlation coefficient (R) of 0.031 and weighted average of $55,714, a difference of 0.35%.
Immigrants from Indonesia vs Immigrants from South Eastern Asia Householder Income Under 25 years

Householder Income Under 25 years Correlation Summary

MeasurementImmigrants from IndonesiaImmigrants from South Eastern Asia
Minimum$19,038$31,667
Maximum$110,408$91,771
Range$91,370$60,104
Mean$58,137$58,961
Median$57,734$59,717
Interquartile 25% (IQ1)$47,139$52,347
Interquartile 75% (IQ3)$67,500$65,355
Interquartile Range (IQR)$20,361$13,008
Standard Deviation (Sample)$18,567$11,452
Standard Deviation (Population)$18,308$11,346

Demographics Similar to Immigrants from Indonesia and Immigrants from South Eastern Asia by Householder Income Under 25 years

In terms of householder income under 25 years, the demographic groups most similar to Immigrants from Indonesia are Immigrants from Romania ($55,522, a difference of 0.0%), Puget Sound Salish ($55,543, a difference of 0.040%), Iranian ($55,548, a difference of 0.050%), Immigrants from Vietnam ($55,562, a difference of 0.070%), and Immigrants from Poland ($55,474, a difference of 0.080%). Similarly, the demographic groups most similar to Immigrants from South Eastern Asia are Immigrants from Korea ($55,716, a difference of 0.0%), Immigrants from Greece ($55,727, a difference of 0.020%), Immigrants from Guyana ($55,726, a difference of 0.020%), Immigrants from Belarus ($55,743, a difference of 0.050%), and Paraguayan ($55,614, a difference of 0.18%).
DemographicsRating | RankHouseholder Income Under 25 years
Immigrants | Russia
100.0
/100
|
#37
Exceptional
$55,891
Immigrants | Iran
100.0
/100
|
#38
Exceptional
$55,880
Immigrants | Belarus
100.0
/100
|
#39
Exceptional
$55,743
Immigrants | Greece
100.0
/100
|
#40
Exceptional
$55,727
Immigrants | Guyana
100.0
/100
|
#41
Exceptional
$55,726
Immigrants | Korea
100.0
/100
|
#42
Exceptional
$55,716
Immigrants | South Eastern Asia
100.0
/100
|
#43
Exceptional
$55,714
Paraguayans
100.0
/100
|
#44
Exceptional
$55,614
Spanish American Indians
100.0
/100
|
#45
Exceptional
$55,573
Immigrants | Eastern Europe
100.0
/100
|
#46
Exceptional
$55,572
Cambodians
100.0
/100
|
#47
Exceptional
$55,571
Immigrants | Vietnam
100.0
/100
|
#48
Exceptional
$55,562
Iranians
100.0
/100
|
#49
Exceptional
$55,548
Puget Sound Salish
100.0
/100
|
#50
Exceptional
$55,543
Immigrants | Romania
100.0
/100
|
#51
Exceptional
$55,522
Immigrants | Indonesia
100.0
/100
|
#52
Exceptional
$55,521
Immigrants | Poland
100.0
/100
|
#53
Exceptional
$55,474
Sri Lankans
100.0
/100
|
#54
Exceptional
$55,470
Immigrants | Ukraine
100.0
/100
|
#55
Exceptional
$55,447
Salvadorans
100.0
/100
|
#56
Exceptional
$55,412
Soviet Union
100.0
/100
|
#57
Exceptional
$55,340