Yugoslavian vs Immigrants from South Eastern Asia Disability Age 65 to 74
COMPARE
Yugoslavian
Immigrants from South Eastern Asia
Disability Age 65 to 74
Disability Age 65 to 74 Comparison
Yugoslavians
Immigrants from South Eastern Asia
23.3%
DISABILITY AGE 65 TO 74
50.2/ 100
METRIC RATING
173rd/ 347
METRIC RANK
23.3%
DISABILITY AGE 65 TO 74
50.0/ 100
METRIC RATING
174th/ 347
METRIC RANK
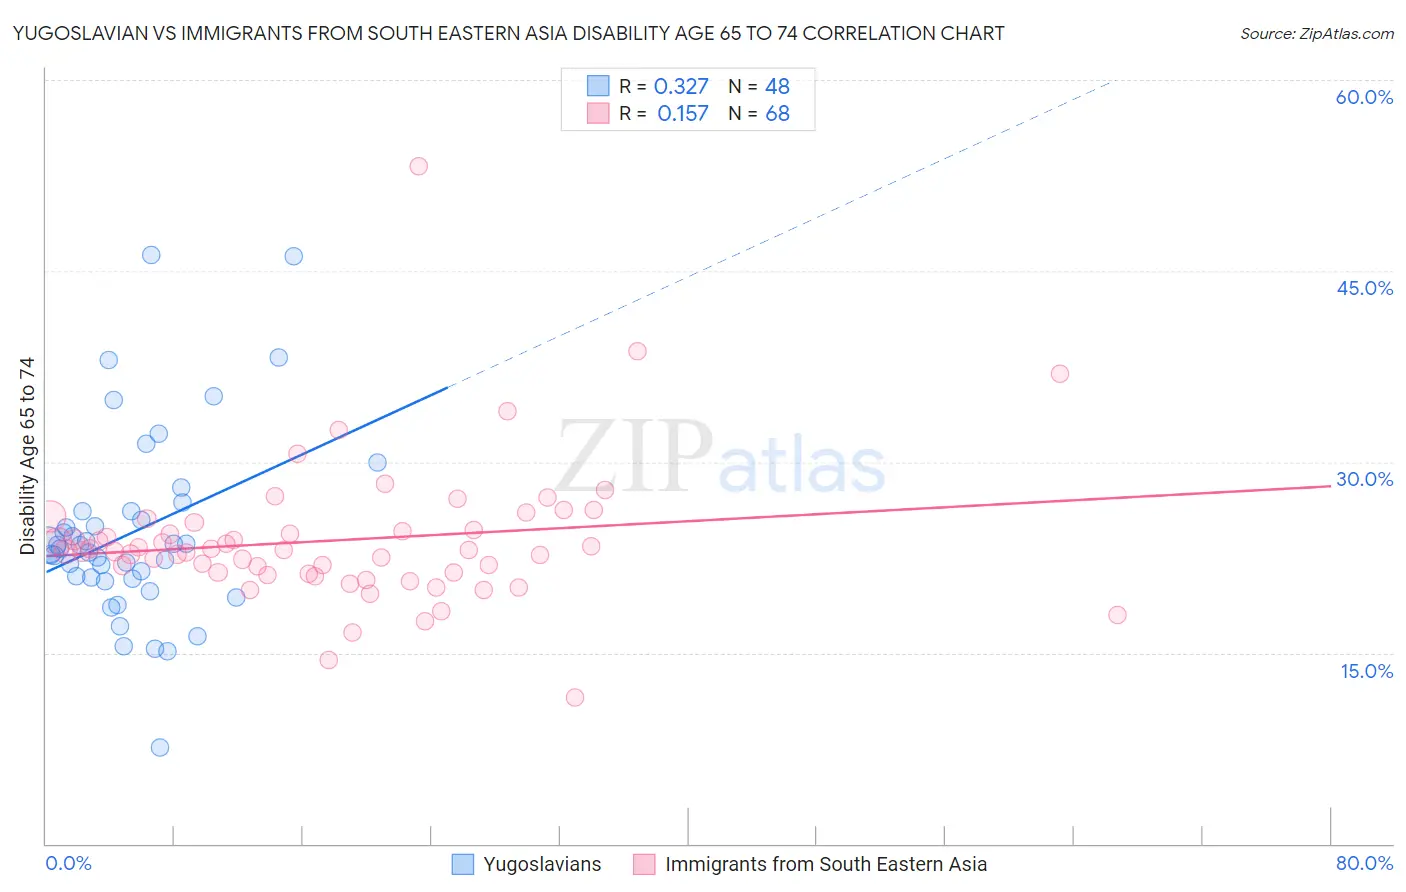
Yugoslavian vs Immigrants from South Eastern Asia Disability Age 65 to 74 Correlation Chart
The statistical analysis conducted on geographies consisting of 285,430,434 people shows a mild positive correlation between the proportion of Yugoslavians and percentage of population with a disability between the ages 65 and 75 in the United States with a correlation coefficient (R) of 0.327 and weighted average of 23.3%. Similarly, the statistical analysis conducted on geographies consisting of 511,151,711 people shows a poor positive correlation between the proportion of Immigrants from South Eastern Asia and percentage of population with a disability between the ages 65 and 75 in the United States with a correlation coefficient (R) of 0.157 and weighted average of 23.3%, a difference of 0.010%.
Disability Age 65 to 74 Correlation Summary
| Measurement | Yugoslavian | Immigrants from South Eastern Asia |
| Minimum | 7.5% | 11.5% |
| Maximum | 46.2% | 53.2% |
| Range | 38.7% | 41.6% |
| Mean | 24.5% | 23.9% |
| Median | 23.3% | 23.0% |
| Interquartile 25% (IQ1) | 20.9% | 21.2% |
| Interquartile 75% (IQ3) | 26.1% | 25.0% |
| Interquartile Range (IQR) | 5.2% | 3.7% |
| Standard Deviation (Sample) | 7.4% | 5.7% |
| Standard Deviation (Population) | 7.3% | 5.6% |
Demographics Similar to Yugoslavians and Immigrants from South Eastern Asia by Disability Age 65 to 74
In terms of disability age 65 to 74, the demographic groups most similar to Yugoslavians are German (23.3%, a difference of 0.020%), Dutch (23.3%, a difference of 0.050%), Cuban (23.3%, a difference of 0.10%), Immigrants from Eritrea (23.4%, a difference of 0.15%), and Immigrants from Haiti (23.4%, a difference of 0.16%). Similarly, the demographic groups most similar to Immigrants from South Eastern Asia are German (23.3%, a difference of 0.030%), Dutch (23.3%, a difference of 0.040%), Cuban (23.3%, a difference of 0.11%), Immigrants from Eritrea (23.4%, a difference of 0.14%), and Immigrants from Haiti (23.4%, a difference of 0.14%).
| Demographics | Rating | Rank | Disability Age 65 to 74 |
| Immigrants | Philippines | 61.1 /100 | #163 | Good 23.2% |
| Sierra Leoneans | 60.9 /100 | #164 | Good 23.2% |
| Vietnamese | 60.8 /100 | #165 | Good 23.2% |
| Immigrants | Afghanistan | 60.5 /100 | #166 | Good 23.2% |
| Immigrants | Bosnia and Herzegovina | 57.6 /100 | #167 | Average 23.2% |
| Pakistanis | 57.0 /100 | #168 | Average 23.2% |
| Icelanders | 54.3 /100 | #169 | Average 23.3% |
| Moroccans | 54.2 /100 | #170 | Average 23.3% |
| Cubans | 51.9 /100 | #171 | Average 23.3% |
| Germans | 50.5 /100 | #172 | Average 23.3% |
| Yugoslavians | 50.2 /100 | #173 | Average 23.3% |
| Immigrants | South Eastern Asia | 50.0 /100 | #174 | Average 23.3% |
| Dutch | 49.4 /100 | #175 | Average 23.3% |
| Immigrants | Eritrea | 47.5 /100 | #176 | Average 23.4% |
| Immigrants | Haiti | 47.5 /100 | #177 | Average 23.4% |
| Guyanese | 45.8 /100 | #178 | Average 23.4% |
| Immigrants | Sierra Leone | 45.8 /100 | #179 | Average 23.4% |
| Scandinavians | 45.6 /100 | #180 | Average 23.4% |
| Assyrians/Chaldeans/Syriacs | 45.3 /100 | #181 | Average 23.4% |
| Irish | 44.4 /100 | #182 | Average 23.4% |
| Immigrants | Eastern Africa | 42.8 /100 | #183 | Average 23.4% |