Italian vs Immigrants from Ghana Householder Income Ages 45 - 64 years

COMPARE

Italian
Race
Ancestry
AfghanAfricanAlaska NativeAlaskan AthabascanAlbanianAleutAlsatianAmericanApacheArabArapahoArgentineanArmenianAssyrian/Chaldean/SyriacAustralianAustrianBahamianBangladeshiBarbadianBasqueBelgianBelizeanBermudanBhutaneseBlackfeetBolivianBrazilianBritishBritish West IndianBulgarianBurmeseCajunCambodianCanadianCape VerdeanCarpatho RusynCelticCentral AmericanCentral American IndianCherokeeCheyenneChickasawChileanChineseChippewaChoctawColombianColvilleComancheCosta RicanCreeCreekCroatianCrowCubanCypriotCzechCzechoslovakianDanishDelawareDominicanDutchDutch West IndianEastern EuropeanEcuadorianEgyptianEnglishEstonianEthiopianEuropeanFijianFilipinoFinnishFrenchFrench American IndianFrench CanadianGermanGerman RussianGhanaianGreekGuamanian/ChamorroGuatemalanGuyaneseHaitianHmongHonduranHopiHoumaHungarianIcelanderIndian (Asian)IndonesianInupiatIranianIraqiIrishIroquoisIsraeliItalianJamaicanJapaneseJordanianKenyanKiowaKoreanLaotianLatvianLebaneseLiberianLithuanianLumbeeLuxembourgerMacedonianMalaysianMalteseMarshalleseMenomineeMexicanMexican American IndianMongolianMoroccanNative HawaiianNavajoNepaleseNew ZealanderNicaraguanNigerianNorthern EuropeanNorwegianOkinawanOsageOttawaPaiutePakistaniPalestinianPanamanianParaguayanPennsylvania GermanPeruvianPimaPolishPortuguesePotawatomiPuebloPuerto RicanPuget Sound SalishRomanianRussianSalvadoranSamoanScandinavianScotch-IrishScottishSeminoleSenegaleseSerbianShoshoneSierra LeoneanSiouxSlavicSlovakSloveneSomaliSouth AfricanSouth AmericanSouth American IndianSoviet UnionSpaniardSpanishSpanish AmericanSpanish American IndianSri LankanSubsaharan AfricanSudaneseSwedishSwissSyrianTaiwaneseThaiTlingit-HaidaTohono O'OdhamTonganTrinidadian and TobagonianTsimshianTurkishU.S. Virgin IslanderUgandanUkrainianUruguayanUteVenezuelanVietnameseWelshWest IndianYakamaYaquiYugoslavianYumanYup'ikZimbabwean
Immigration
NonimmigrantsImmigrantsAfghanistanAfricaAlbaniaArgentinaArmeniaAsiaAustraliaAustriaBahamasBangladeshBarbadosBelarusBelgiumBelizeBoliviaBosnia and HerzegovinaBrazilBulgariaBurma/MyanmarCabo VerdeCambodiaCameroonCanadaCaribbeanCentral AmericaChileChinaColombiaCongoCosta RicaCroatiaCubaCzechoslovakiaDenmarkDominicaDominican RepublicEastern AfricaEastern AsiaEastern EuropeEcuadorEgyptEl SalvadorEnglandEritreaEthiopiaEuropeFijiFranceGermanyGreeceGrenadaGuatemalaGuyanaHaitiHondurasHong KongHungaryIndiaIndonesiaIranIraqIrelandIsraelItalyJamaicaJapanJordanKazakhstanKenyaKoreaKuwaitLaosLatin AmericaLatviaLebanonLiberiaLithuaniaMalaysiaMexicoMicronesiaMiddle AfricaMoldovaMoroccoNepalNetherlandsNicaraguaNigeriaNorth AmericaNorth MacedoniaNorthern AfricaNorthern EuropeNorwayOceaniaPakistanPanamaPeruPhilippinesPolandPortugalRomaniaRussiaSaudi ArabiaScotlandSenegalSerbiaSierra LeoneSingaporeSomaliaSouth AfricaSouth AmericaSouth Central AsiaSouth Eastern AsiaSouthern EuropeSpainSri LankaSt. Vincent and the GrenadinesSudanSwedenSwitzerlandSyriaTaiwanThailandTrinidad and TobagoTurkeyUgandaUkraineUruguayUzbekistanVenezuelaVietnamWest IndiesWestern AfricaWestern AsiaWestern EuropeYemenZaireZimbabweAzores
Immigrants from Ghana
Race
Ancestry
AfghanAfricanAlaska NativeAlaskan AthabascanAlbanianAleutAlsatianAmericanApacheArabArapahoArgentineanArmenianAssyrian/Chaldean/SyriacAustralianAustrianBahamianBangladeshiBarbadianBasqueBelgianBelizeanBermudanBhutaneseBlackfeetBolivianBrazilianBritishBritish West IndianBulgarianBurmeseCajunCambodianCanadianCape VerdeanCarpatho RusynCelticCentral AmericanCentral American IndianCherokeeCheyenneChickasawChileanChineseChippewaChoctawColombianColvilleComancheCosta RicanCreeCreekCroatianCrowCubanCypriotCzechCzechoslovakianDanishDelawareDominicanDutchDutch West IndianEastern EuropeanEcuadorianEgyptianEnglishEstonianEthiopianEuropeanFijianFilipinoFinnishFrenchFrench American IndianFrench CanadianGermanGerman RussianGhanaianGreekGuamanian/ChamorroGuatemalanGuyaneseHaitianHmongHonduranHopiHoumaHungarianIcelanderIndian (Asian)IndonesianInupiatIranianIraqiIrishIroquoisIsraeliJamaicanJapaneseJordanianKenyanKiowaKoreanLaotianLatvianLebaneseLiberianLithuanianLumbeeLuxembourgerMacedonianMalaysianMalteseMarshalleseMenomineeMexicanMexican American IndianMongolianMoroccanNative HawaiianNavajoNepaleseNew ZealanderNicaraguanNigerianNorthern EuropeanNorwegianOkinawanOsageOttawaPaiutePakistaniPalestinianPanamanianParaguayanPennsylvania GermanPeruvianPimaPolishPortuguesePotawatomiPuebloPuerto RicanPuget Sound SalishRomanianRussianSalvadoranSamoanScandinavianScotch-IrishScottishSeminoleSenegaleseSerbianShoshoneSierra LeoneanSiouxSlavicSlovakSloveneSomaliSouth AfricanSouth AmericanSouth American IndianSoviet UnionSpaniardSpanishSpanish AmericanSpanish American IndianSri LankanSubsaharan AfricanSudaneseSwedishSwissSyrianTaiwaneseThaiTlingit-HaidaTohono O'OdhamTonganTrinidadian and TobagonianTsimshianTurkishU.S. Virgin IslanderUgandanUkrainianUruguayanUteVenezuelanVietnameseWelshWest IndianYakamaYaquiYugoslavianYumanYup'ikZimbabwean
Immigration
NonimmigrantsImmigrantsAfghanistanAfricaAlbaniaArgentinaArmeniaAsiaAustraliaAustriaBahamasBangladeshBarbadosBelarusBelgiumBelizeBoliviaBosnia and HerzegovinaBrazilBulgariaBurma/MyanmarCabo VerdeCambodiaCameroonCanadaCaribbeanCentral AmericaChileChinaColombiaCongoCosta RicaCroatiaCubaCzechoslovakiaDenmarkDominicaDominican RepublicEastern AfricaEastern AsiaEastern EuropeEcuadorEgyptEl SalvadorEnglandEritreaEthiopiaEuropeFijiFranceGermanyGhanaGreeceGrenadaGuatemalaGuyanaHaitiHondurasHong KongHungaryIndiaIndonesiaIranIraqIrelandIsraelItalyJamaicaJapanJordanKazakhstanKenyaKoreaKuwaitLaosLatin AmericaLatviaLebanonLiberiaLithuaniaMalaysiaMexicoMicronesiaMiddle AfricaMoldovaMoroccoNepalNetherlandsNicaraguaNigeriaNorth AmericaNorth MacedoniaNorthern AfricaNorthern EuropeNorwayOceaniaPakistanPanamaPeruPhilippinesPolandPortugalRomaniaRussiaSaudi ArabiaScotlandSenegalSerbiaSierra LeoneSingaporeSomaliaSouth AfricaSouth AmericaSouth Central AsiaSouth Eastern AsiaSouthern EuropeSpainSri LankaSt. Vincent and the GrenadinesSudanSwedenSwitzerlandSyriaTaiwanThailandTrinidad and TobagoTurkeyUgandaUkraineUruguayUzbekistanVenezuelaVietnamWest IndiesWestern AfricaWestern AsiaWestern EuropeYemenZaireZimbabweAzores
Householder Income Ages 45 - 64 years
Income
Poverty
Unemployment
Labor Participation
Family Structure
Vehicle Availability
Education Level
Disability

Householder Income Ages 45 - 64 years Comparison

Italians

Immigrants from Ghana

Exceptional
Tragic
$110,224
HOUSEHOLDER INCOME AGES 45 - 64 YEARS
99.3/ 100
METRIC RATING
71st/ 347
METRIC RANK
$94,982
HOUSEHOLDER INCOME AGES 45 - 64 YEARS
6.4/ 100
METRIC RATING
217th/ 347
METRIC RANK

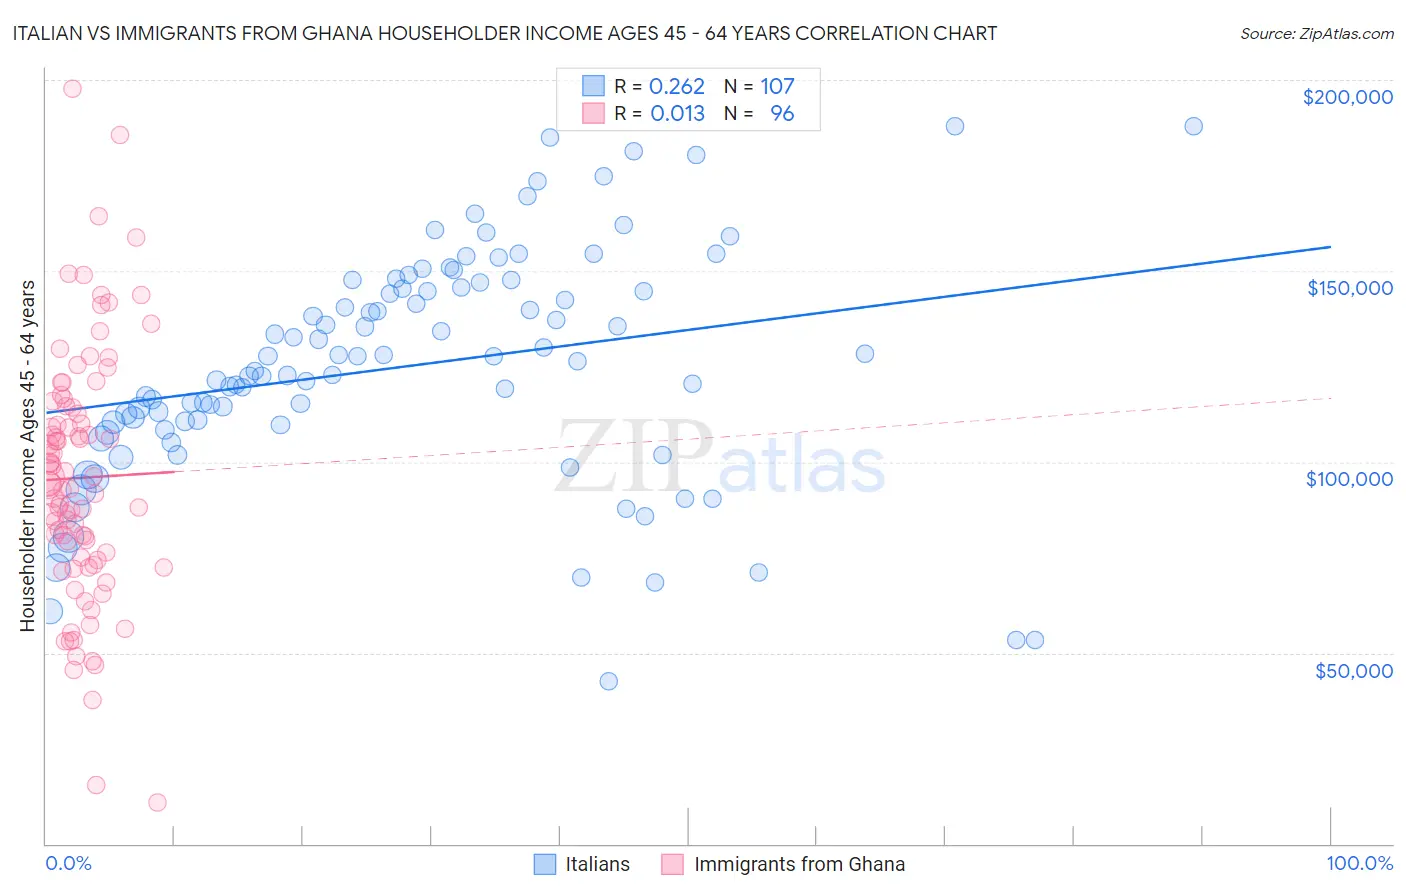
Italian vs Immigrants from Ghana Householder Income Ages 45 - 64 years Correlation Chart

The statistical analysis conducted on geographies consisting of 571,010,703 people shows a weak positive correlation between the proportion of Italians and household income with householder between the ages 45 and 64 in the United States with a correlation coefficient (R) of 0.262 and weighted average of $110,224. Similarly, the statistical analysis conducted on geographies consisting of 199,704,082 people shows no correlation between the proportion of Immigrants from Ghana and household income with householder between the ages 45 and 64 in the United States with a correlation coefficient (R) of 0.013 and weighted average of $94,982, a difference of 16.1%.
Italian vs Immigrants from Ghana Householder Income Ages 45 - 64 years

Householder Income Ages 45 - 64 years Correlation Summary

MeasurementItalianImmigrants from Ghana
Minimum$42,562$10,938
Maximum$188,030$197,851
Range$145,468$186,913
Mean$125,039$95,814
Median$126,199$94,054
Interquartile 25% (IQ1)$109,794$74,592
Interquartile 75% (IQ3)$145,518$114,445
Interquartile Range (IQR)$35,724$39,852
Standard Deviation (Sample)$30,277$33,020
Standard Deviation (Population)$30,135$32,848

Similar Demographics by Householder Income Ages 45 - 64 years

Demographics Similar to Italians by Householder Income Ages 45 - 64 years

In terms of householder income ages 45 - 64 years, the demographic groups most similar to Italians are Assyrian/Chaldean/Syriac ($110,201, a difference of 0.020%), Korean ($110,334, a difference of 0.10%), Argentinean ($110,103, a difference of 0.11%), Immigrants from Italy ($110,434, a difference of 0.19%), and Immigrants from Egypt ($109,941, a difference of 0.26%).
DemographicsRating | RankHouseholder Income Ages 45 - 64 years
Immigrants | Latvia
99.6
/100
|
#64
Exceptional
$111,454
Immigrants | Belarus
99.6
/100
|
#65
Exceptional
$111,430
New Zealanders
99.6
/100
|
#66
Exceptional
$111,286
Laotians
99.5
/100
|
#67
Exceptional
$111,051
Immigrants | Romania
99.4
/100
|
#68
Exceptional
$110,633
Immigrants | Italy
99.4
/100
|
#69
Exceptional
$110,434
Koreans
99.3
/100
|
#70
Exceptional
$110,334
Italians
99.3
/100
|
#71
Exceptional
$110,224
Assyrians/Chaldeans/Syriacs
99.3
/100
|
#72
Exceptional
$110,201
Argentineans
99.3
/100
|
#73
Exceptional
$110,103
Immigrants | Egypt
99.2
/100
|
#74
Exceptional
$109,941
South Africans
99.1
/100
|
#75
Exceptional
$109,719
Paraguayans
99.0
/100
|
#76
Exceptional
$109,447
Immigrants | England
99.0
/100
|
#77
Exceptional
$109,446
Immigrants | Canada
99.0
/100
|
#78
Exceptional
$109,402

Demographics Similar to Immigrants from Ghana by Householder Income Ages 45 - 64 years

In terms of householder income ages 45 - 64 years, the demographic groups most similar to Immigrants from Ghana are Delaware ($94,914, a difference of 0.070%), Immigrants from Armenia ($94,863, a difference of 0.13%), Salvadoran ($94,842, a difference of 0.15%), Immigrants from Nigeria ($94,804, a difference of 0.19%), and Immigrants from Venezuela ($95,342, a difference of 0.38%).
DemographicsRating | RankHouseholder Income Ages 45 - 64 years
Tsimshian
14.5
/100
|
#210
Poor
$96,783
Immigrants | Cambodia
13.0
/100
|
#211
Poor
$96,537
Venezuelans
12.6
/100
|
#212
Poor
$96,460
Immigrants | Uruguay
10.7
/100
|
#213
Poor
$96,086
Panamanians
10.6
/100
|
#214
Poor
$96,066
Nigerians
8.2
/100
|
#215
Tragic
$95,492
Immigrants | Venezuela
7.6
/100
|
#216
Tragic
$95,342
Immigrants | Ghana
6.4
/100
|
#217
Tragic
$94,982
Delaware
6.2
/100
|
#218
Tragic
$94,914
Immigrants | Armenia
6.1
/100
|
#219
Tragic
$94,863
Salvadorans
6.0
/100
|
#220
Tragic
$94,842
Immigrants | Nigeria
5.9
/100
|
#221
Tragic
$94,804
Malaysians
5.2
/100
|
#222
Tragic
$94,517
Immigrants | Nonimmigrants
5.0
/100
|
#223
Tragic
$94,448
Immigrants | Bosnia and Herzegovina
4.6
/100
|
#224
Tragic
$94,288