Samoan vs Icelander Median Household Income
COMPARE
Samoan
Icelander
Median Household Income
Median Household Income Comparison
Samoans
Icelanders
$86,498
MEDIAN HOUSEHOLD INCOME
71.0/ 100
METRIC RATING
157th/ 347
METRIC RANK
$85,797
MEDIAN HOUSEHOLD INCOME
61.0/ 100
METRIC RATING
168th/ 347
METRIC RANK
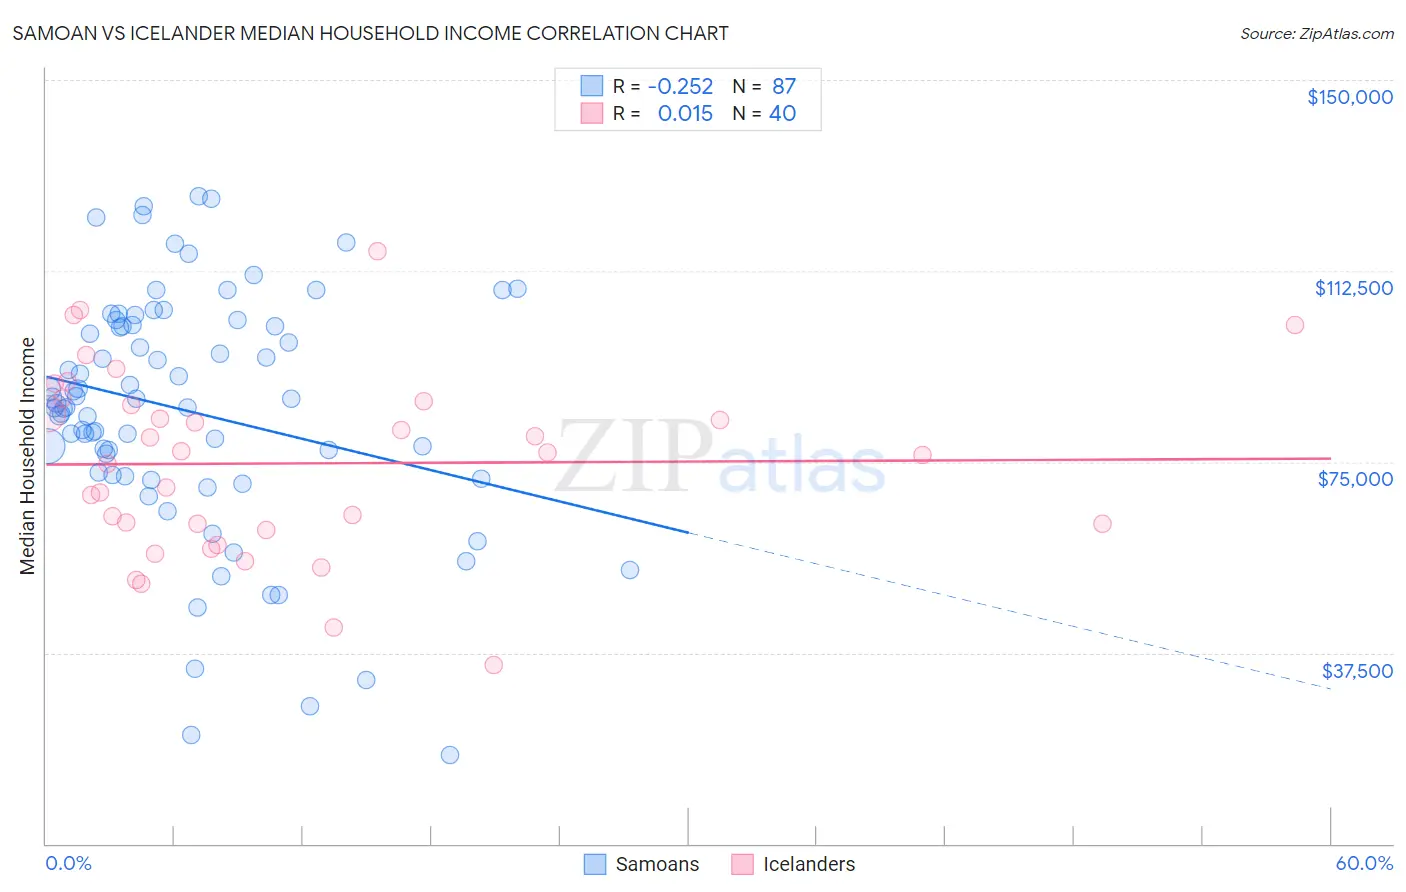
Samoan vs Icelander Median Household Income Correlation Chart
The statistical analysis conducted on geographies consisting of 225,063,012 people shows a weak negative correlation between the proportion of Samoans and median household income in the United States with a correlation coefficient (R) of -0.252 and weighted average of $86,498. Similarly, the statistical analysis conducted on geographies consisting of 159,599,934 people shows no correlation between the proportion of Icelanders and median household income in the United States with a correlation coefficient (R) of 0.015 and weighted average of $85,797, a difference of 0.82%.
Median Household Income Correlation Summary
| Measurement | Samoan | Icelander |
| Minimum | $17,452 | $35,179 |
| Maximum | $127,143 | $116,250 |
| Range | $109,691 | $81,071 |
| Mean | $84,959 | $74,702 |
| Median | $86,491 | $76,562 |
| Interquartile 25% (IQ1) | $72,428 | $62,204 |
| Interquartile 75% (IQ3) | $101,996 | $86,541 |
| Interquartile Range (IQR) | $29,568 | $24,337 |
| Standard Deviation (Sample) | $23,715 | $17,966 |
| Standard Deviation (Population) | $23,578 | $17,740 |
Demographics Similar to Samoans and Icelanders by Median Household Income
In terms of median household income, the demographic groups most similar to Samoans are Immigrants from Albania ($86,534, a difference of 0.040%), Moroccan ($86,468, a difference of 0.040%), Immigrants from Uzbekistan ($86,425, a difference of 0.080%), Luxembourger ($86,418, a difference of 0.090%), and Slavic ($86,398, a difference of 0.12%). Similarly, the demographic groups most similar to Icelanders are Immigrants ($85,818, a difference of 0.020%), Colombian ($85,716, a difference of 0.090%), Swiss ($85,681, a difference of 0.14%), Immigrants from South America ($85,611, a difference of 0.22%), and Slovene ($85,562, a difference of 0.27%).
| Demographics | Rating | Rank | Median Household Income |
| Immigrants | Saudi Arabia | 75.8 /100 | #152 | Good $86,875 |
| South Americans | 75.1 /100 | #153 | Good $86,824 |
| Immigrants | Germany | 74.4 /100 | #154 | Good $86,764 |
| Carpatho Rusyns | 72.8 /100 | #155 | Good $86,635 |
| Immigrants | Albania | 71.5 /100 | #156 | Good $86,534 |
| Samoans | 71.0 /100 | #157 | Good $86,498 |
| Moroccans | 70.6 /100 | #158 | Good $86,468 |
| Immigrants | Uzbekistan | 70.1 /100 | #159 | Good $86,425 |
| Luxembourgers | 70.0 /100 | #160 | Good $86,418 |
| Slavs | 69.7 /100 | #161 | Good $86,398 |
| Guamanians/Chamorros | 67.7 /100 | #162 | Good $86,255 |
| Czechs | 66.4 /100 | #163 | Good $86,164 |
| Irish | 66.2 /100 | #164 | Good $86,145 |
| Norwegians | 65.3 /100 | #165 | Good $86,084 |
| Scandinavians | 65.1 /100 | #166 | Good $86,073 |
| Immigrants | Immigrants | 61.3 /100 | #167 | Good $85,818 |
| Icelanders | 61.0 /100 | #168 | Good $85,797 |
| Colombians | 59.7 /100 | #169 | Average $85,716 |
| Swiss | 59.2 /100 | #170 | Average $85,681 |
| Immigrants | South America | 58.1 /100 | #171 | Average $85,611 |
| Slovenes | 57.4 /100 | #172 | Average $85,562 |