Venezuelan vs Fijian Householder Income Over 65 years
COMPARE
Venezuelan
Fijian
Householder Income Over 65 years
Householder Income Over 65 years Comparison
Venezuelans
Fijians
$58,026
HOUSEHOLDER INCOME OVER 65 YEARS
4.4/ 100
METRIC RATING
225th/ 347
METRIC RANK
$56,768
HOUSEHOLDER INCOME OVER 65 YEARS
1.2/ 100
METRIC RATING
238th/ 347
METRIC RANK
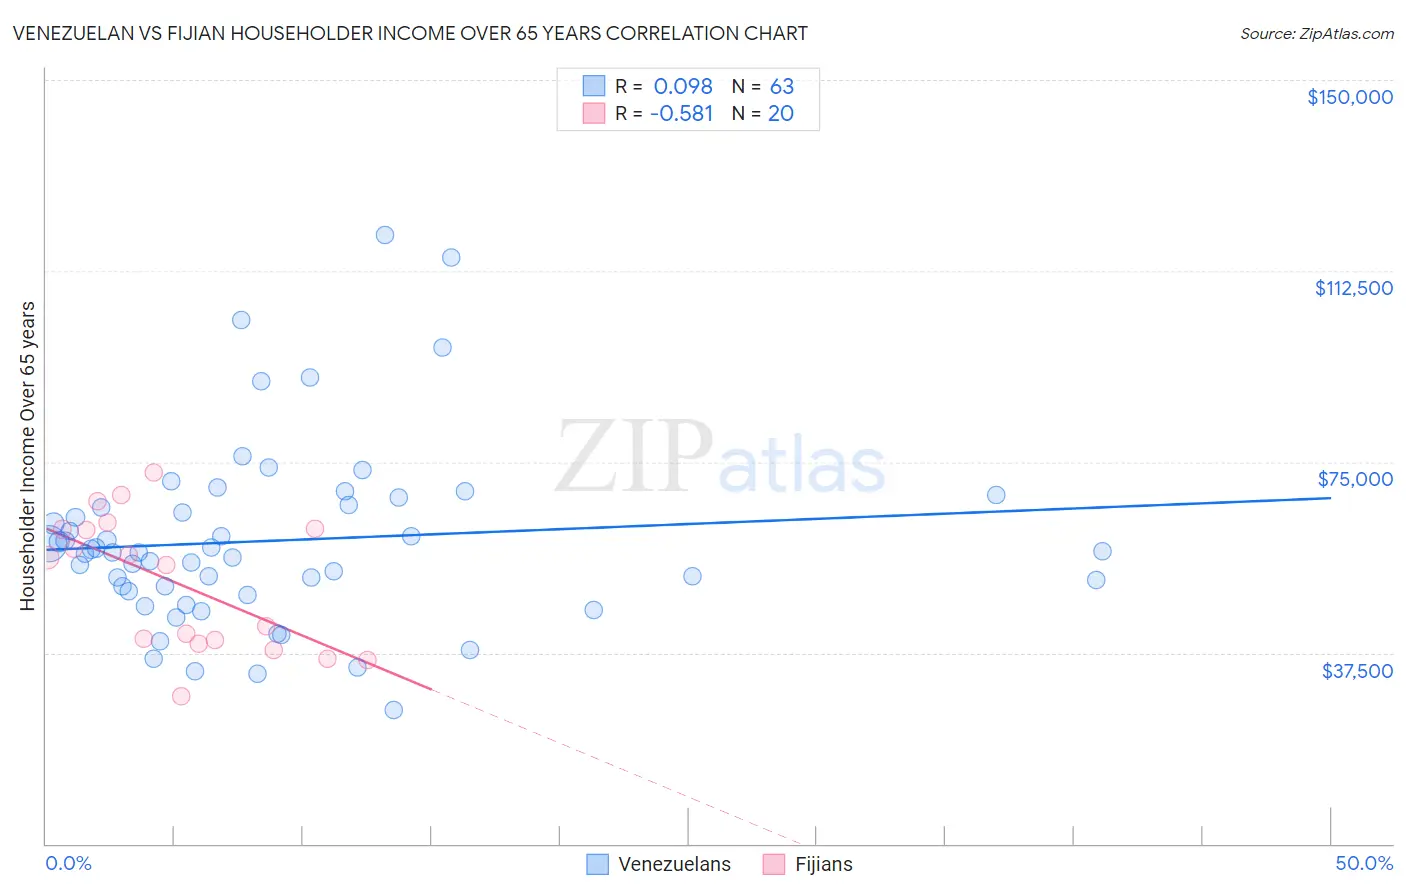
Venezuelan vs Fijian Householder Income Over 65 years Correlation Chart
The statistical analysis conducted on geographies consisting of 305,429,725 people shows a slight positive correlation between the proportion of Venezuelans and household income with householder over the age of 65 in the United States with a correlation coefficient (R) of 0.098 and weighted average of $58,026. Similarly, the statistical analysis conducted on geographies consisting of 55,863,642 people shows a substantial negative correlation between the proportion of Fijians and household income with householder over the age of 65 in the United States with a correlation coefficient (R) of -0.581 and weighted average of $56,768, a difference of 2.2%.
Householder Income Over 65 years Correlation Summary
| Measurement | Venezuelan | Fijian |
| Minimum | $26,376 | $29,091 |
| Maximum | $119,643 | $72,983 |
| Range | $93,267 | $43,892 |
| Mean | $59,526 | $51,272 |
| Median | $57,305 | $55,405 |
| Interquartile 25% (IQ1) | $49,696 | $39,651 |
| Interquartile 75% (IQ3) | $66,429 | $61,780 |
| Interquartile Range (IQR) | $16,733 | $22,129 |
| Standard Deviation (Sample) | $18,107 | $13,144 |
| Standard Deviation (Population) | $17,963 | $12,811 |
Demographics Similar to Venezuelans and Fijians by Householder Income Over 65 years
In terms of householder income over 65 years, the demographic groups most similar to Venezuelans are French Canadian ($57,975, a difference of 0.090%), Japanese ($57,919, a difference of 0.18%), Bermudan ($58,171, a difference of 0.25%), Tsimshian ($58,202, a difference of 0.30%), and Delaware ($58,214, a difference of 0.32%). Similarly, the demographic groups most similar to Fijians are Immigrants from Laos ($56,722, a difference of 0.080%), Subsaharan African ($56,615, a difference of 0.27%), Immigrants from Panama ($56,944, a difference of 0.31%), Immigrants from Uruguay ($56,975, a difference of 0.36%), and Spanish American ($57,021, a difference of 0.45%).
| Demographics | Rating | Rank | Householder Income Over 65 years |
| Immigrants | El Salvador | 5.4 /100 | #221 | Tragic $58,226 |
| Delaware | 5.3 /100 | #222 | Tragic $58,214 |
| Tsimshian | 5.2 /100 | #223 | Tragic $58,202 |
| Bermudans | 5.1 /100 | #224 | Tragic $58,171 |
| Venezuelans | 4.4 /100 | #225 | Tragic $58,026 |
| French Canadians | 4.2 /100 | #226 | Tragic $57,975 |
| Japanese | 3.9 /100 | #227 | Tragic $57,919 |
| Immigrants | Albania | 3.6 /100 | #228 | Tragic $57,828 |
| Immigrants | Colombia | 3.0 /100 | #229 | Tragic $57,658 |
| Immigrants | Cambodia | 2.8 /100 | #230 | Tragic $57,580 |
| Immigrants | Nonimmigrants | 2.4 /100 | #231 | Tragic $57,426 |
| Immigrants | Venezuela | 2.3 /100 | #232 | Tragic $57,371 |
| Immigrants | Western Africa | 1.7 /100 | #233 | Tragic $57,119 |
| Immigrants | Burma/Myanmar | 1.7 /100 | #234 | Tragic $57,114 |
| Spanish Americans | 1.6 /100 | #235 | Tragic $57,021 |
| Immigrants | Uruguay | 1.5 /100 | #236 | Tragic $56,975 |
| Immigrants | Panama | 1.5 /100 | #237 | Tragic $56,944 |
| Fijians | 1.2 /100 | #238 | Tragic $56,768 |
| Immigrants | Laos | 1.2 /100 | #239 | Tragic $56,722 |
| Sub-Saharan Africans | 1.0 /100 | #240 | Tragic $56,615 |
| Immigrants | Guyana | 0.9 /100 | #241 | Tragic $56,495 |