Uruguayan vs Slovene Householder Income Under 25 years
COMPARE
Uruguayan
Slovene
Householder Income Under 25 years
Householder Income Under 25 years Comparison
Uruguayans
Slovenes
$52,465
HOUSEHOLDER INCOME UNDER 25 YEARS
66.2/ 100
METRIC RATING
161st/ 347
METRIC RANK
$50,886
HOUSEHOLDER INCOME UNDER 25 YEARS
4.0/ 100
METRIC RATING
232nd/ 347
METRIC RANK
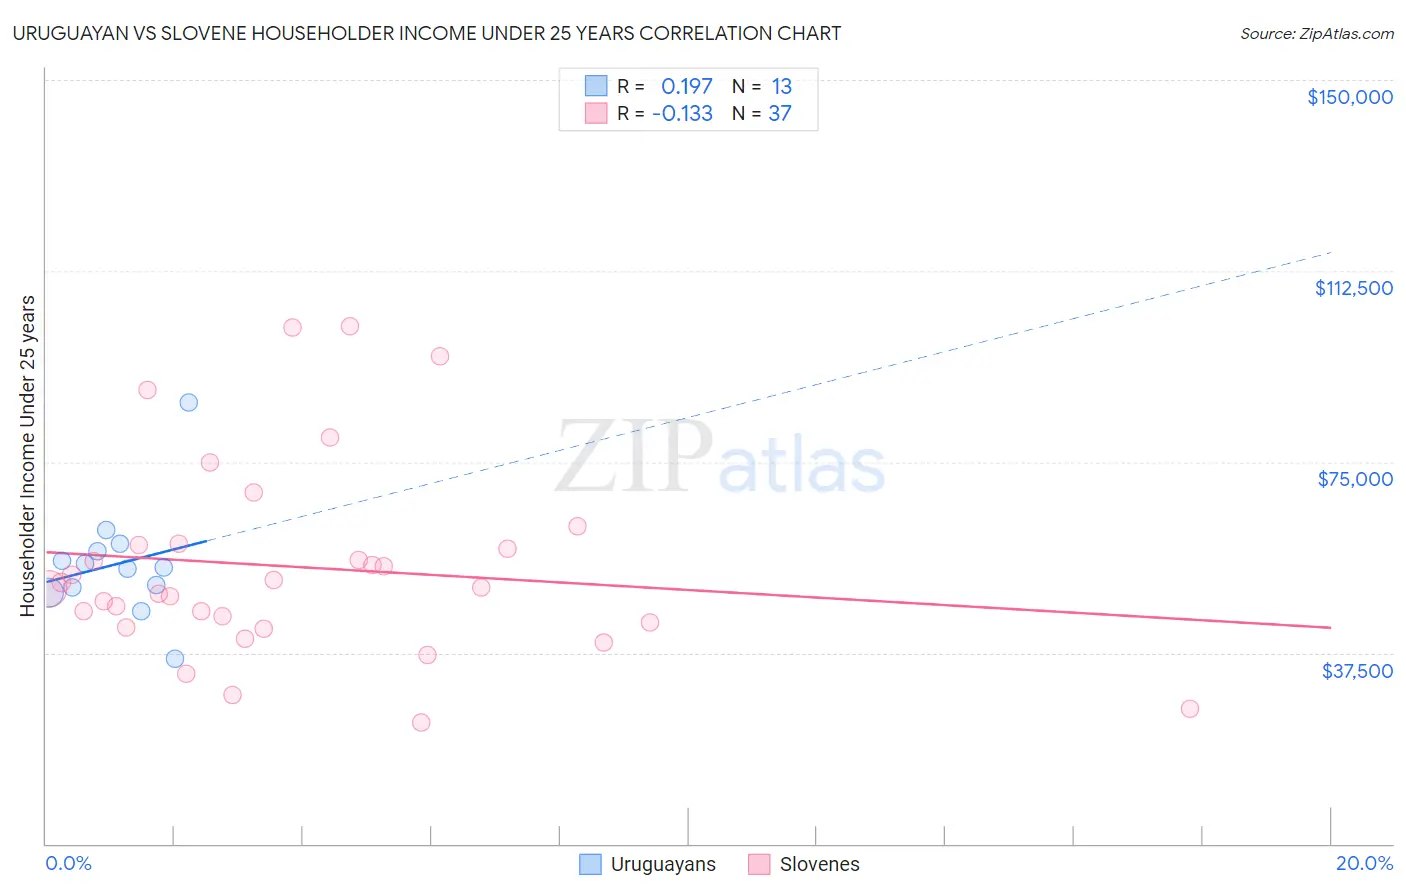
Uruguayan vs Slovene Householder Income Under 25 years Correlation Chart
The statistical analysis conducted on geographies consisting of 131,435,070 people shows a poor positive correlation between the proportion of Uruguayans and household income with householder under the age of 25 in the United States with a correlation coefficient (R) of 0.197 and weighted average of $52,465. Similarly, the statistical analysis conducted on geographies consisting of 227,902,139 people shows a poor negative correlation between the proportion of Slovenes and household income with householder under the age of 25 in the United States with a correlation coefficient (R) of -0.133 and weighted average of $50,886, a difference of 3.1%.
Householder Income Under 25 years Correlation Summary
| Measurement | Uruguayan | Slovene |
| Minimum | $36,250 | $23,750 |
| Maximum | $86,743 | $101,719 |
| Range | $50,493 | $77,969 |
| Mean | $55,050 | $54,363 |
| Median | $54,158 | $50,342 |
| Interquartile 25% (IQ1) | $49,818 | $42,924 |
| Interquartile 75% (IQ3) | $58,169 | $58,799 |
| Interquartile Range (IQR) | $8,351 | $15,875 |
| Standard Deviation (Sample) | $11,484 | $19,097 |
| Standard Deviation (Population) | $11,034 | $18,837 |
Similar Demographics by Householder Income Under 25 years
Demographics Similar to Uruguayans by Householder Income Under 25 years
In terms of householder income under 25 years, the demographic groups most similar to Uruguayans are Immigrants from Cambodia ($52,450, a difference of 0.030%), Immigrants from Chile ($52,440, a difference of 0.050%), Immigrants from Trinidad and Tobago ($52,437, a difference of 0.050%), Immigrants from Turkey ($52,503, a difference of 0.070%), and Polish ($52,407, a difference of 0.11%).
| Demographics | Rating | Rank | Householder Income Under 25 years |
| Immigrants | Azores | 74.2 /100 | #154 | Good $52,621 |
| Immigrants | Denmark | 73.8 /100 | #155 | Good $52,612 |
| Immigrants | Nepal | 73.7 /100 | #156 | Good $52,611 |
| Ghanaians | 72.9 /100 | #157 | Good $52,594 |
| Immigrants | Netherlands | 72.8 /100 | #158 | Good $52,592 |
| Mongolians | 70.2 /100 | #159 | Good $52,540 |
| Immigrants | Turkey | 68.3 /100 | #160 | Good $52,503 |
| Uruguayans | 66.2 /100 | #161 | Good $52,465 |
| Immigrants | Cambodia | 65.4 /100 | #162 | Good $52,450 |
| Immigrants | Chile | 64.8 /100 | #163 | Good $52,440 |
| Immigrants | Trinidad and Tobago | 64.7 /100 | #164 | Good $52,437 |
| Poles | 63.0 /100 | #165 | Good $52,407 |
| Immigrants | Austria | 62.6 /100 | #166 | Good $52,400 |
| Immigrants | Uganda | 61.1 /100 | #167 | Good $52,374 |
| Japanese | 60.5 /100 | #168 | Good $52,365 |
Demographics Similar to Slovenes by Householder Income Under 25 years
In terms of householder income under 25 years, the demographic groups most similar to Slovenes are Ugandan ($50,923, a difference of 0.070%), Pennsylvania German ($50,852, a difference of 0.070%), Jamaican ($50,929, a difference of 0.080%), Yuman ($50,933, a difference of 0.090%), and Kenyan ($50,815, a difference of 0.14%).
| Demographics | Rating | Rank | Householder Income Under 25 years |
| Immigrants | Jamaica | 5.6 /100 | #225 | Tragic $51,038 |
| Yugoslavians | 5.5 /100 | #226 | Tragic $51,028 |
| Immigrants | Central America | 5.4 /100 | #227 | Tragic $51,022 |
| Immigrants | Norway | 5.0 /100 | #228 | Tragic $50,984 |
| Yuman | 4.4 /100 | #229 | Tragic $50,933 |
| Jamaicans | 4.4 /100 | #230 | Tragic $50,929 |
| Ugandans | 4.3 /100 | #231 | Tragic $50,923 |
| Slovenes | 4.0 /100 | #232 | Tragic $50,886 |
| Pennsylvania Germans | 3.7 /100 | #233 | Tragic $50,852 |
| Kenyans | 3.3 /100 | #234 | Tragic $50,815 |
| Spanish | 3.3 /100 | #235 | Tragic $50,813 |
| English | 3.3 /100 | #236 | Tragic $50,805 |
| Germans | 3.3 /100 | #237 | Tragic $50,804 |
| Iraqis | 3.2 /100 | #238 | Tragic $50,802 |
| Immigrants | Caribbean | 2.9 /100 | #239 | Tragic $50,757 |