Uruguayan vs Slovene No Vehicles in Household
COMPARE
Uruguayan
Slovene
No Vehicles in Household
No Vehicles in Household Comparison
Uruguayans
Slovenes
11.3%
NO VEHICLES IN HOUSEHOLD
7.7/ 100
METRIC RATING
223rd/ 347
METRIC RANK
8.0%
NO VEHICLES IN HOUSEHOLD
99.9/ 100
METRIC RATING
53rd/ 347
METRIC RANK
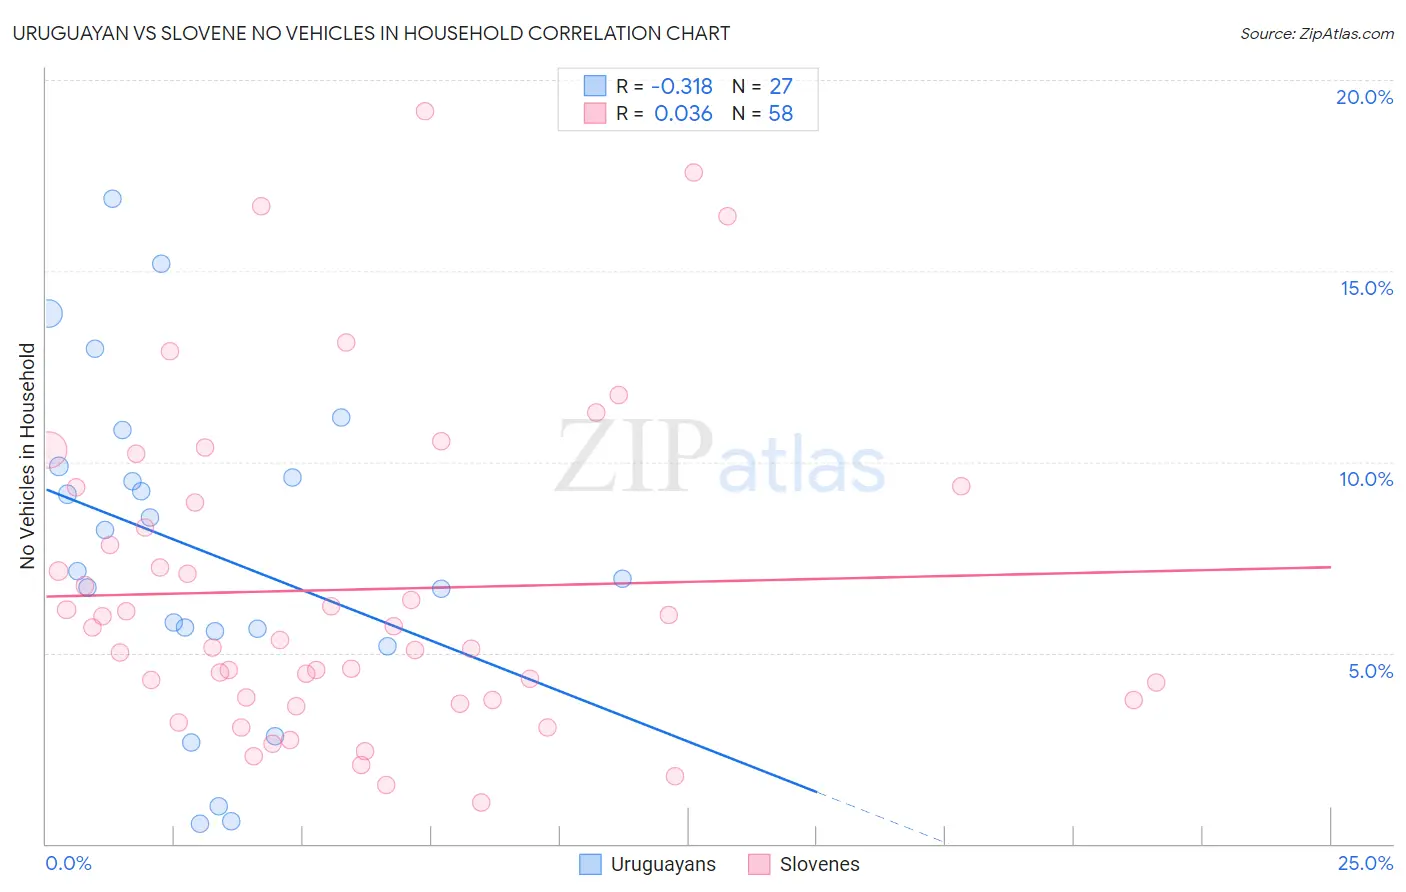
Uruguayan vs Slovene No Vehicles in Household Correlation Chart
The statistical analysis conducted on geographies consisting of 144,673,371 people shows a mild negative correlation between the proportion of Uruguayans and percentage of households with no vehicle available in the United States with a correlation coefficient (R) of -0.318 and weighted average of 11.3%. Similarly, the statistical analysis conducted on geographies consisting of 260,894,292 people shows no correlation between the proportion of Slovenes and percentage of households with no vehicle available in the United States with a correlation coefficient (R) of 0.036 and weighted average of 8.0%, a difference of 40.3%.
No Vehicles in Household Correlation Summary
| Measurement | Uruguayan | Slovene |
| Minimum | 0.52% | 1.1% |
| Maximum | 16.9% | 19.2% |
| Range | 16.4% | 18.1% |
| Mean | 7.7% | 6.7% |
| Median | 7.1% | 5.5% |
| Interquartile 25% (IQ1) | 5.6% | 3.8% |
| Interquartile 75% (IQ3) | 9.9% | 8.9% |
| Interquartile Range (IQR) | 4.3% | 5.2% |
| Standard Deviation (Sample) | 4.2% | 4.2% |
| Standard Deviation (Population) | 4.2% | 4.1% |
Similar Demographics by No Vehicles in Household
Demographics Similar to Uruguayans by No Vehicles in Household
In terms of no vehicles in household, the demographic groups most similar to Uruguayans are Immigrants from South America (11.3%, a difference of 0.16%), Immigrants from Hong Kong (11.3%, a difference of 0.22%), Peruvian (11.2%, a difference of 0.30%), Immigrants from Sierra Leone (11.3%, a difference of 0.59%), and Immigrants from Zaire (11.2%, a difference of 0.75%).
| Demographics | Rating | Rank | No Vehicles in Household |
| Immigrants | Argentina | 10.6 /100 | #216 | Poor 11.2% |
| Dutch West Indians | 10.2 /100 | #217 | Poor 11.2% |
| Immigrants | Guatemala | 10.0 /100 | #218 | Tragic 11.2% |
| Argentineans | 9.6 /100 | #219 | Tragic 11.2% |
| Immigrants | Zaire | 9.6 /100 | #220 | Tragic 11.2% |
| Peruvians | 8.4 /100 | #221 | Tragic 11.2% |
| Immigrants | South America | 8.0 /100 | #222 | Tragic 11.3% |
| Uruguayans | 7.7 /100 | #223 | Tragic 11.3% |
| Immigrants | Hong Kong | 7.2 /100 | #224 | Tragic 11.3% |
| Immigrants | Sierra Leone | 6.4 /100 | #225 | Tragic 11.3% |
| Immigrants | Somalia | 5.4 /100 | #226 | Tragic 11.4% |
| Immigrants | Pakistan | 5.4 /100 | #227 | Tragic 11.4% |
| Immigrants | Romania | 5.3 /100 | #228 | Tragic 11.4% |
| Ugandans | 5.3 /100 | #229 | Tragic 11.4% |
| Immigrants | Norway | 5.1 /100 | #230 | Tragic 11.4% |
Demographics Similar to Slovenes by No Vehicles in Household
In terms of no vehicles in household, the demographic groups most similar to Slovenes are Hawaiian (8.0%, a difference of 0.0%), Immigrants from Venezuela (8.1%, a difference of 0.31%), Celtic (8.1%, a difference of 0.40%), Korean (8.0%, a difference of 0.58%), and Belgian (8.0%, a difference of 0.68%).
| Demographics | Rating | Rank | No Vehicles in Household |
| Spanish | 99.9 /100 | #46 | Exceptional 7.9% |
| Northern Europeans | 99.9 /100 | #47 | Exceptional 7.9% |
| Afghans | 99.9 /100 | #48 | Exceptional 8.0% |
| Guamanians/Chamorros | 99.9 /100 | #49 | Exceptional 8.0% |
| Belgians | 99.9 /100 | #50 | Exceptional 8.0% |
| Koreans | 99.9 /100 | #51 | Exceptional 8.0% |
| Hawaiians | 99.9 /100 | #52 | Exceptional 8.0% |
| Slovenes | 99.9 /100 | #53 | Exceptional 8.0% |
| Immigrants | Venezuela | 99.9 /100 | #54 | Exceptional 8.1% |
| Celtics | 99.9 /100 | #55 | Exceptional 8.1% |
| Immigrants | Afghanistan | 99.9 /100 | #56 | Exceptional 8.1% |
| Venezuelans | 99.8 /100 | #57 | Exceptional 8.1% |
| Immigrants | Mexico | 99.8 /100 | #58 | Exceptional 8.1% |
| Immigrants | India | 99.8 /100 | #59 | Exceptional 8.2% |
| Immigrants | Laos | 99.8 /100 | #60 | Exceptional 8.2% |