Uruguayan vs Immigrants from Guatemala Householder Income Under 25 years
COMPARE
Uruguayan
Immigrants from Guatemala
Householder Income Under 25 years
Householder Income Under 25 years Comparison
Uruguayans
Immigrants from Guatemala
$52,465
HOUSEHOLDER INCOME UNDER 25 YEARS
66.2/ 100
METRIC RATING
161st/ 347
METRIC RANK
$51,447
HOUSEHOLDER INCOME UNDER 25 YEARS
14.0/ 100
METRIC RATING
202nd/ 347
METRIC RANK
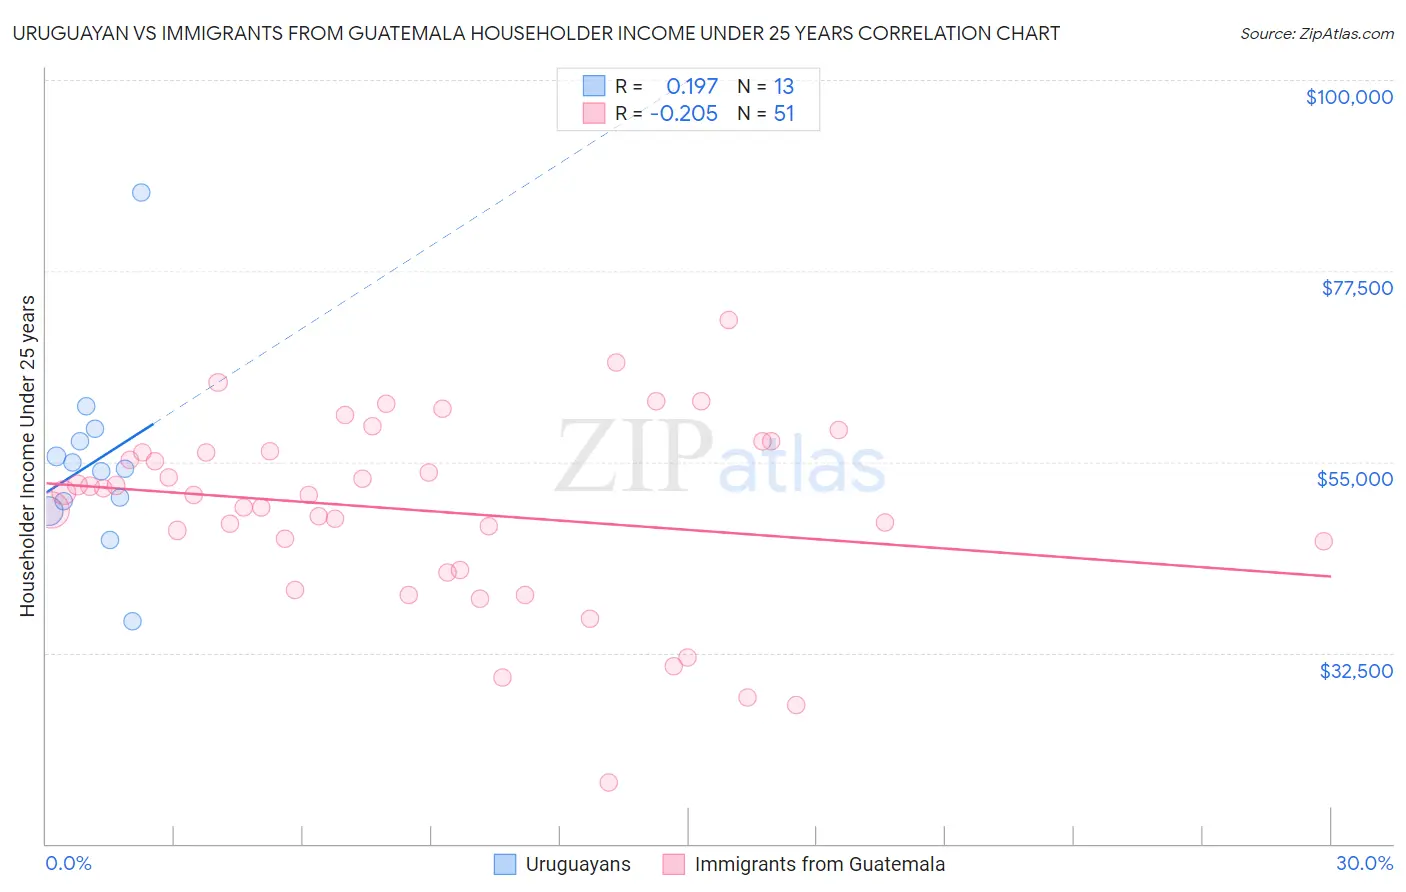
Uruguayan vs Immigrants from Guatemala Householder Income Under 25 years Correlation Chart
The statistical analysis conducted on geographies consisting of 131,435,070 people shows a poor positive correlation between the proportion of Uruguayans and household income with householder under the age of 25 in the United States with a correlation coefficient (R) of 0.197 and weighted average of $52,465. Similarly, the statistical analysis conducted on geographies consisting of 322,942,463 people shows a weak negative correlation between the proportion of Immigrants from Guatemala and household income with householder under the age of 25 in the United States with a correlation coefficient (R) of -0.205 and weighted average of $51,447, a difference of 2.0%.
Householder Income Under 25 years Correlation Summary
| Measurement | Uruguayan | Immigrants from Guatemala |
| Minimum | $36,250 | $17,188 |
| Maximum | $86,743 | $71,705 |
| Range | $50,493 | $54,517 |
| Mean | $55,050 | $49,268 |
| Median | $54,158 | $51,116 |
| Interquartile 25% (IQ1) | $49,818 | $42,266 |
| Interquartile 75% (IQ3) | $58,169 | $56,271 |
| Interquartile Range (IQR) | $8,351 | $14,004 |
| Standard Deviation (Sample) | $11,484 | $11,118 |
| Standard Deviation (Population) | $11,034 | $11,008 |
Similar Demographics by Householder Income Under 25 years
Demographics Similar to Uruguayans by Householder Income Under 25 years
In terms of householder income under 25 years, the demographic groups most similar to Uruguayans are Immigrants from Cambodia ($52,450, a difference of 0.030%), Immigrants from Chile ($52,440, a difference of 0.050%), Immigrants from Trinidad and Tobago ($52,437, a difference of 0.050%), Immigrants from Turkey ($52,503, a difference of 0.070%), and Polish ($52,407, a difference of 0.11%).
| Demographics | Rating | Rank | Householder Income Under 25 years |
| Immigrants | Azores | 74.2 /100 | #154 | Good $52,621 |
| Immigrants | Denmark | 73.8 /100 | #155 | Good $52,612 |
| Immigrants | Nepal | 73.7 /100 | #156 | Good $52,611 |
| Ghanaians | 72.9 /100 | #157 | Good $52,594 |
| Immigrants | Netherlands | 72.8 /100 | #158 | Good $52,592 |
| Mongolians | 70.2 /100 | #159 | Good $52,540 |
| Immigrants | Turkey | 68.3 /100 | #160 | Good $52,503 |
| Uruguayans | 66.2 /100 | #161 | Good $52,465 |
| Immigrants | Cambodia | 65.4 /100 | #162 | Good $52,450 |
| Immigrants | Chile | 64.8 /100 | #163 | Good $52,440 |
| Immigrants | Trinidad and Tobago | 64.7 /100 | #164 | Good $52,437 |
| Poles | 63.0 /100 | #165 | Good $52,407 |
| Immigrants | Austria | 62.6 /100 | #166 | Good $52,400 |
| Immigrants | Uganda | 61.1 /100 | #167 | Good $52,374 |
| Japanese | 60.5 /100 | #168 | Good $52,365 |
Demographics Similar to Immigrants from Guatemala by Householder Income Under 25 years
In terms of householder income under 25 years, the demographic groups most similar to Immigrants from Guatemala are Immigrants from Cameroon ($51,433, a difference of 0.030%), Czech ($51,421, a difference of 0.050%), Immigrants from West Indies ($51,479, a difference of 0.060%), British ($51,477, a difference of 0.060%), and Immigrants from Syria ($51,494, a difference of 0.090%).
| Demographics | Rating | Rank | Householder Income Under 25 years |
| Estonians | 16.4 /100 | #195 | Poor $51,523 |
| Palestinians | 16.1 /100 | #196 | Poor $51,515 |
| Pima | 15.7 /100 | #197 | Poor $51,503 |
| Immigrants | Syria | 15.4 /100 | #198 | Poor $51,494 |
| Swiss | 15.4 /100 | #199 | Poor $51,493 |
| Immigrants | West Indies | 14.9 /100 | #200 | Poor $51,479 |
| British | 14.9 /100 | #201 | Poor $51,477 |
| Immigrants | Guatemala | 14.0 /100 | #202 | Poor $51,447 |
| Immigrants | Cameroon | 13.6 /100 | #203 | Poor $51,433 |
| Czechs | 13.2 /100 | #204 | Poor $51,421 |
| Cape Verdeans | 12.3 /100 | #205 | Poor $51,387 |
| Immigrants | Latin America | 12.3 /100 | #206 | Poor $51,387 |
| South Africans | 12.2 /100 | #207 | Poor $51,383 |
| Immigrants | Jordan | 11.9 /100 | #208 | Poor $51,370 |
| Syrians | 11.4 /100 | #209 | Poor $51,353 |