Immigrants from Bahamas vs Peruvian Householder Income Ages 25 - 44 years
COMPARE
Immigrants from Bahamas
Peruvian
Householder Income Ages 25 - 44 years
Householder Income Ages 25 - 44 years Comparison
Immigrants from Bahamas
Peruvians
$76,910
HOUSEHOLDER INCOME AGES 25 - 44 YEARS
0.0/ 100
METRIC RATING
327th/ 347
METRIC RANK
$98,886
HOUSEHOLDER INCOME AGES 25 - 44 YEARS
91.7/ 100
METRIC RATING
121st/ 347
METRIC RANK
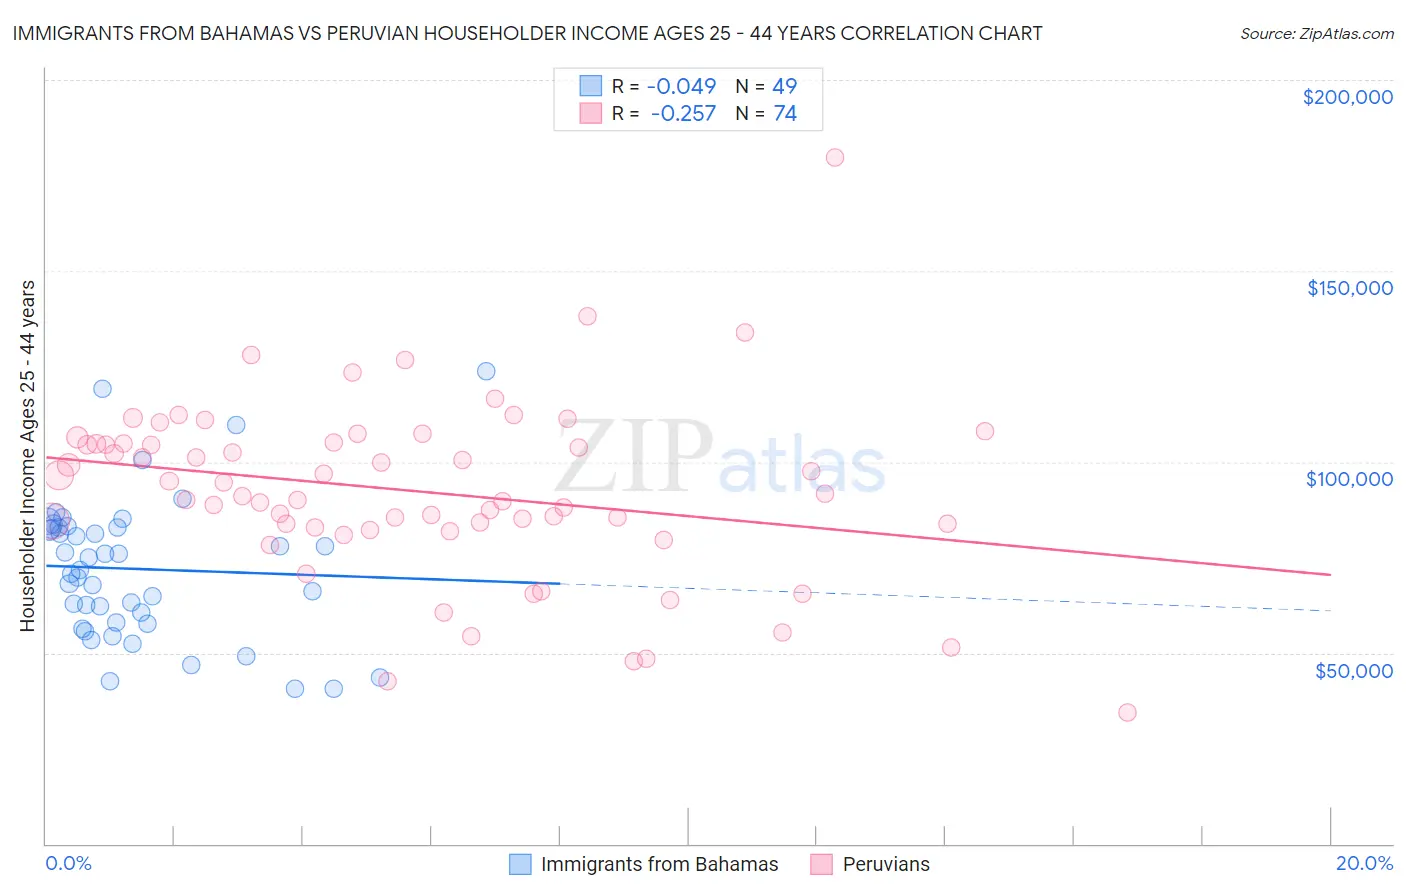
Immigrants from Bahamas vs Peruvian Householder Income Ages 25 - 44 years Correlation Chart
The statistical analysis conducted on geographies consisting of 104,540,789 people shows no correlation between the proportion of Immigrants from Bahamas and household income with householder between the ages 25 and 44 in the United States with a correlation coefficient (R) of -0.049 and weighted average of $76,910. Similarly, the statistical analysis conducted on geographies consisting of 362,388,350 people shows a weak negative correlation between the proportion of Peruvians and household income with householder between the ages 25 and 44 in the United States with a correlation coefficient (R) of -0.257 and weighted average of $98,886, a difference of 28.6%.
Householder Income Ages 25 - 44 years Correlation Summary
| Measurement | Immigrants from Bahamas | Peruvian |
| Minimum | $40,456 | $34,268 |
| Maximum | $123,699 | $179,830 |
| Range | $83,243 | $145,562 |
| Mean | $71,953 | $92,331 |
| Median | $71,583 | $91,247 |
| Interquartile 25% (IQ1) | $57,810 | $82,833 |
| Interquartile 75% (IQ3) | $82,867 | $104,839 |
| Interquartile Range (IQR) | $25,057 | $22,006 |
| Standard Deviation (Sample) | $18,615 | $23,482 |
| Standard Deviation (Population) | $18,424 | $23,323 |
Similar Demographics by Householder Income Ages 25 - 44 years
Demographics Similar to Immigrants from Bahamas by Householder Income Ages 25 - 44 years
In terms of householder income ages 25 - 44 years, the demographic groups most similar to Immigrants from Bahamas are Houma ($77,044, a difference of 0.17%), Sioux ($77,089, a difference of 0.23%), Immigrants from Cuba ($76,701, a difference of 0.27%), Seminole ($76,584, a difference of 0.42%), and Dutch West Indian ($77,260, a difference of 0.46%).
| Demographics | Rating | Rank | Householder Income Ages 25 - 44 years |
| Choctaw | 0.0 /100 | #320 | Tragic $78,168 |
| Immigrants | Zaire | 0.0 /100 | #321 | Tragic $78,045 |
| Chickasaw | 0.0 /100 | #322 | Tragic $77,929 |
| Immigrants | Honduras | 0.0 /100 | #323 | Tragic $77,328 |
| Dutch West Indians | 0.0 /100 | #324 | Tragic $77,260 |
| Sioux | 0.0 /100 | #325 | Tragic $77,089 |
| Houma | 0.0 /100 | #326 | Tragic $77,044 |
| Immigrants | Bahamas | 0.0 /100 | #327 | Tragic $76,910 |
| Immigrants | Cuba | 0.0 /100 | #328 | Tragic $76,701 |
| Seminole | 0.0 /100 | #329 | Tragic $76,584 |
| Yakama | 0.0 /100 | #330 | Tragic $76,226 |
| Natives/Alaskans | 0.0 /100 | #331 | Tragic $75,647 |
| Bahamians | 0.0 /100 | #332 | Tragic $75,395 |
| Hopi | 0.0 /100 | #333 | Tragic $75,002 |
| Creek | 0.0 /100 | #334 | Tragic $74,847 |
Demographics Similar to Peruvians by Householder Income Ages 25 - 44 years
In terms of householder income ages 25 - 44 years, the demographic groups most similar to Peruvians are Immigrants from Uzbekistan ($98,849, a difference of 0.040%), Palestinian ($98,777, a difference of 0.11%), Swedish ($99,136, a difference of 0.25%), Jordanian ($99,186, a difference of 0.30%), and Zimbabwean ($98,586, a difference of 0.30%).
| Demographics | Rating | Rank | Householder Income Ages 25 - 44 years |
| Immigrants | Western Asia | 94.0 /100 | #114 | Exceptional $99,516 |
| Carpatho Rusyns | 93.7 /100 | #115 | Exceptional $99,449 |
| Portuguese | 93.7 /100 | #116 | Exceptional $99,429 |
| Immigrants | Northern Africa | 93.0 /100 | #117 | Exceptional $99,232 |
| Syrians | 92.9 /100 | #118 | Exceptional $99,215 |
| Jordanians | 92.8 /100 | #119 | Exceptional $99,186 |
| Swedes | 92.7 /100 | #120 | Exceptional $99,136 |
| Peruvians | 91.7 /100 | #121 | Exceptional $98,886 |
| Immigrants | Uzbekistan | 91.5 /100 | #122 | Exceptional $98,849 |
| Palestinians | 91.2 /100 | #123 | Exceptional $98,777 |
| Zimbabweans | 90.3 /100 | #124 | Exceptional $98,586 |
| Pakistanis | 89.3 /100 | #125 | Excellent $98,401 |
| British | 89.1 /100 | #126 | Excellent $98,359 |
| Serbians | 88.9 /100 | #127 | Excellent $98,320 |
| Europeans | 88.9 /100 | #128 | Excellent $98,310 |