Trinidadian and Tobagonian vs Immigrants from the Azores Householder Income Ages 25 - 44 years
COMPARE
Trinidadian and Tobagonian
Immigrants from the Azores
Householder Income Ages 25 - 44 years
Householder Income Ages 25 - 44 years Comparison
Trinidadians and Tobagonians
Immigrants from the Azores
$89,856
HOUSEHOLDER INCOME AGES 25 - 44 YEARS
6.8/ 100
METRIC RATING
220th/ 347
METRIC RANK
$92,322
HOUSEHOLDER INCOME AGES 25 - 44 YEARS
22.4/ 100
METRIC RATING
194th/ 347
METRIC RANK
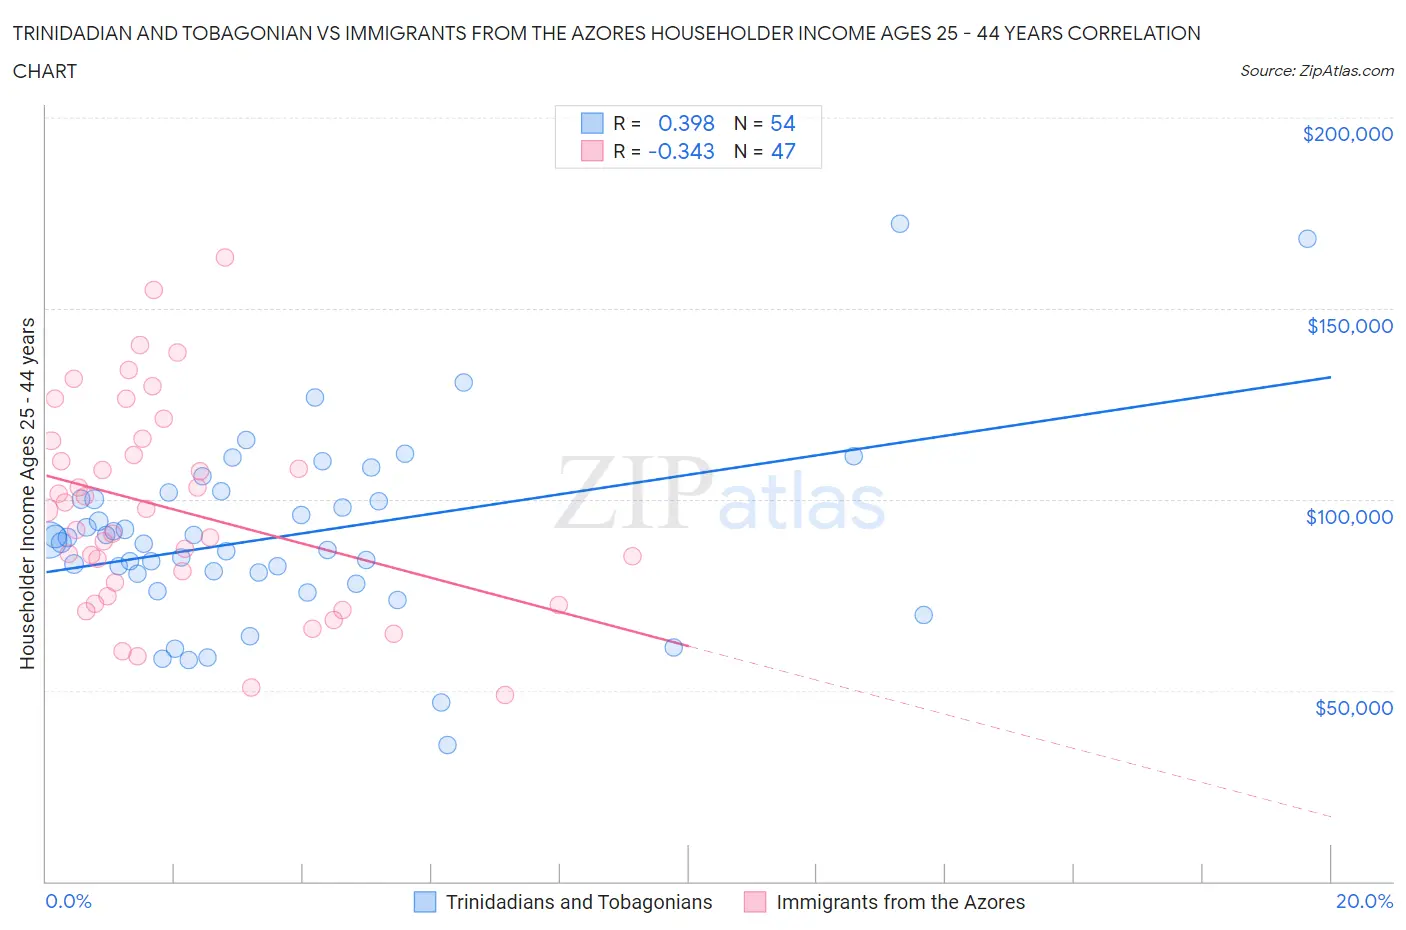
Trinidadian and Tobagonian vs Immigrants from the Azores Householder Income Ages 25 - 44 years Correlation Chart
The statistical analysis conducted on geographies consisting of 219,529,863 people shows a mild positive correlation between the proportion of Trinidadians and Tobagonians and household income with householder between the ages 25 and 44 in the United States with a correlation coefficient (R) of 0.398 and weighted average of $89,856. Similarly, the statistical analysis conducted on geographies consisting of 46,239,396 people shows a mild negative correlation between the proportion of Immigrants from the Azores and household income with householder between the ages 25 and 44 in the United States with a correlation coefficient (R) of -0.343 and weighted average of $92,322, a difference of 2.7%.
Householder Income Ages 25 - 44 years Correlation Summary
| Measurement | Trinidadian and Tobagonian | Immigrants from the Azores |
| Minimum | $35,714 | $48,897 |
| Maximum | $172,171 | $163,387 |
| Range | $136,457 | $114,490 |
| Mean | $90,466 | $97,325 |
| Median | $88,984 | $97,135 |
| Interquartile 25% (IQ1) | $80,428 | $74,519 |
| Interquartile 75% (IQ3) | $100,047 | $115,346 |
| Interquartile Range (IQR) | $19,619 | $40,827 |
| Standard Deviation (Sample) | $24,416 | $26,928 |
| Standard Deviation (Population) | $24,189 | $26,640 |
Similar Demographics by Householder Income Ages 25 - 44 years
Demographics Similar to Trinidadians and Tobagonians by Householder Income Ages 25 - 44 years
In terms of householder income ages 25 - 44 years, the demographic groups most similar to Trinidadians and Tobagonians are Delaware ($89,876, a difference of 0.020%), Guyanese ($89,940, a difference of 0.090%), Immigrants from Trinidad and Tobago ($89,748, a difference of 0.12%), Scotch-Irish ($89,969, a difference of 0.13%), and Immigrants from Ecuador ($89,673, a difference of 0.20%).
| Demographics | Rating | Rank | Householder Income Ages 25 - 44 years |
| Immigrants | Bangladesh | 9.3 /100 | #213 | Tragic $90,448 |
| Immigrants | Africa | 8.9 /100 | #214 | Tragic $90,372 |
| Panamanians | 8.1 /100 | #215 | Tragic $90,193 |
| Ghanaians | 7.9 /100 | #216 | Tragic $90,137 |
| Scotch-Irish | 7.3 /100 | #217 | Tragic $89,969 |
| Guyanese | 7.1 /100 | #218 | Tragic $89,940 |
| Delaware | 6.9 /100 | #219 | Tragic $89,876 |
| Trinidadians and Tobagonians | 6.8 /100 | #220 | Tragic $89,856 |
| Immigrants | Trinidad and Tobago | 6.5 /100 | #221 | Tragic $89,748 |
| Immigrants | Ecuador | 6.2 /100 | #222 | Tragic $89,673 |
| Immigrants | Guyana | 5.9 /100 | #223 | Tragic $89,586 |
| Barbadians | 5.9 /100 | #224 | Tragic $89,565 |
| Immigrants | Panama | 5.5 /100 | #225 | Tragic $89,451 |
| Immigrants | Iraq | 5.5 /100 | #226 | Tragic $89,444 |
| Immigrants | St. Vincent and the Grenadines | 4.1 /100 | #227 | Tragic $88,888 |
Demographics Similar to Immigrants from the Azores by Householder Income Ages 25 - 44 years
In terms of householder income ages 25 - 44 years, the demographic groups most similar to Immigrants from the Azores are Samoan ($92,385, a difference of 0.070%), Celtic ($92,241, a difference of 0.090%), Immigrants from Colombia ($92,204, a difference of 0.13%), Spanish ($92,200, a difference of 0.13%), and Vietnamese ($92,089, a difference of 0.25%).
| Demographics | Rating | Rank | Householder Income Ages 25 - 44 years |
| Spaniards | 34.0 /100 | #187 | Fair $93,366 |
| Immigrants | Sierra Leone | 30.9 /100 | #188 | Fair $93,115 |
| Dutch | 30.5 /100 | #189 | Fair $93,081 |
| Welsh | 30.0 /100 | #190 | Fair $93,039 |
| Tlingit-Haida | 29.4 /100 | #191 | Fair $92,987 |
| Immigrants | Costa Rica | 28.2 /100 | #192 | Fair $92,876 |
| Samoans | 23.0 /100 | #193 | Fair $92,385 |
| Immigrants | Azores | 22.4 /100 | #194 | Fair $92,322 |
| Celtics | 21.6 /100 | #195 | Fair $92,241 |
| Immigrants | Colombia | 21.3 /100 | #196 | Fair $92,204 |
| Spanish | 21.2 /100 | #197 | Fair $92,200 |
| Vietnamese | 20.2 /100 | #198 | Fair $92,089 |
| Kenyans | 16.8 /100 | #199 | Poor $91,684 |
| Whites/Caucasians | 16.7 /100 | #200 | Poor $91,668 |
| Japanese | 16.4 /100 | #201 | Poor $91,624 |