Trinidadian and Tobagonian vs Immigrants from Ethiopia Master's Degree
COMPARE
Trinidadian and Tobagonian
Immigrants from Ethiopia
Master's Degree
Master's Degree Comparison
Trinidadians and Tobagonians
Immigrants from Ethiopia
14.4%
MASTER'S DEGREE
23.5/ 100
METRIC RATING
205th/ 347
METRIC RANK
17.9%
MASTER'S DEGREE
99.8/ 100
METRIC RATING
68th/ 347
METRIC RANK
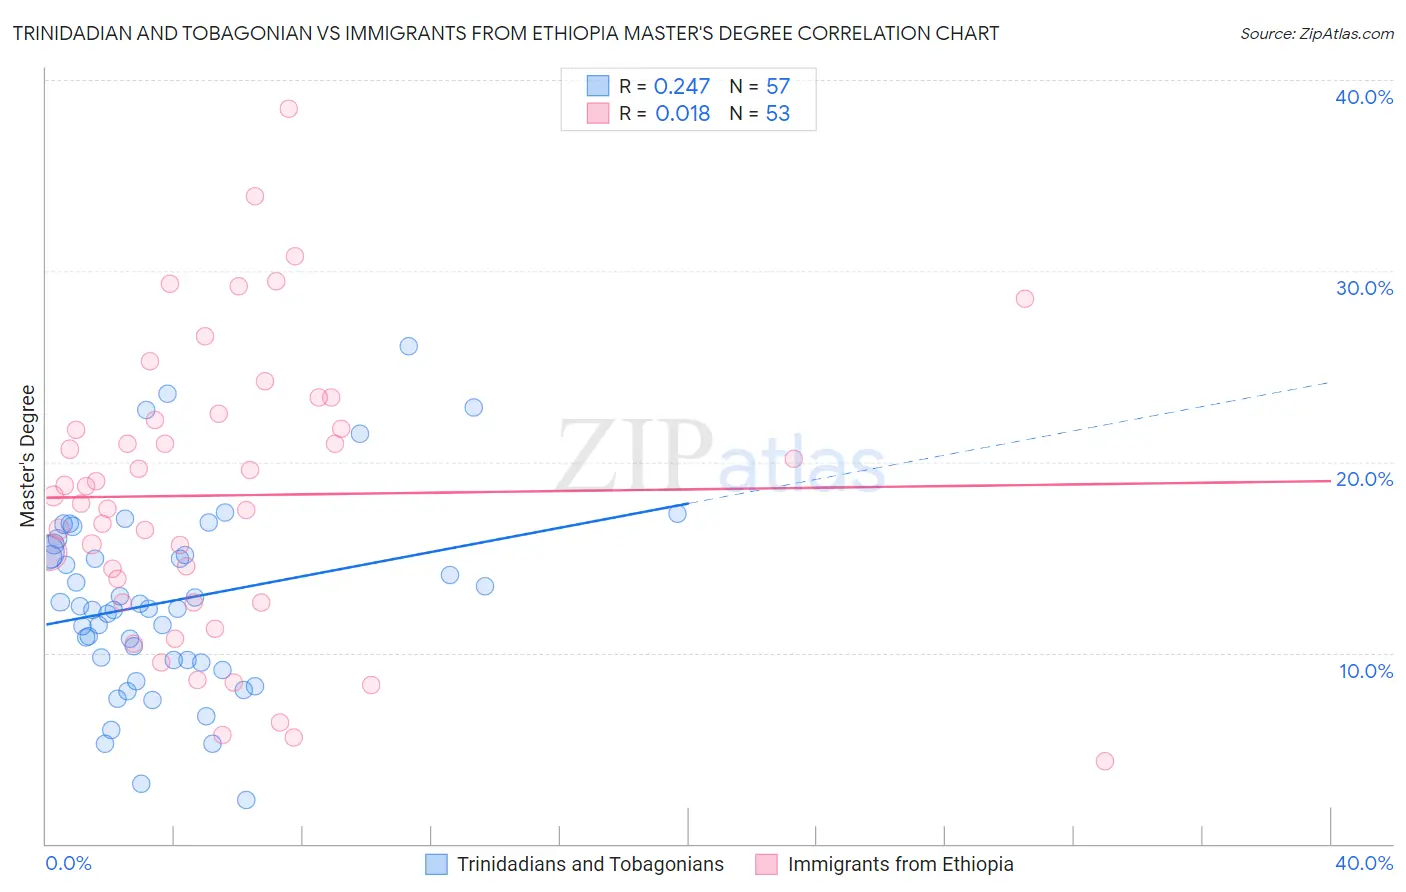
Trinidadian and Tobagonian vs Immigrants from Ethiopia Master's Degree Correlation Chart
The statistical analysis conducted on geographies consisting of 219,795,372 people shows a weak positive correlation between the proportion of Trinidadians and Tobagonians and percentage of population with at least master's degree education in the United States with a correlation coefficient (R) of 0.247 and weighted average of 14.4%. Similarly, the statistical analysis conducted on geographies consisting of 211,528,614 people shows no correlation between the proportion of Immigrants from Ethiopia and percentage of population with at least master's degree education in the United States with a correlation coefficient (R) of 0.018 and weighted average of 17.9%, a difference of 24.8%.
Master's Degree Correlation Summary
| Measurement | Trinidadian and Tobagonian | Immigrants from Ethiopia |
| Minimum | 2.3% | 4.3% |
| Maximum | 26.1% | 38.5% |
| Range | 23.8% | 34.2% |
| Mean | 12.7% | 18.2% |
| Median | 12.3% | 18.2% |
| Interquartile 25% (IQ1) | 9.6% | 12.6% |
| Interquartile 75% (IQ3) | 15.5% | 22.4% |
| Interquartile Range (IQR) | 5.9% | 9.8% |
| Standard Deviation (Sample) | 4.9% | 7.5% |
| Standard Deviation (Population) | 4.9% | 7.5% |
Similar Demographics by Master's Degree
Demographics Similar to Trinidadians and Tobagonians by Master's Degree
In terms of master's degree, the demographic groups most similar to Trinidadians and Tobagonians are French (14.4%, a difference of 0.030%), Scandinavian (14.4%, a difference of 0.040%), Yugoslavian (14.4%, a difference of 0.15%), Immigrants from Western Africa (14.4%, a difference of 0.26%), and Scotch-Irish (14.4%, a difference of 0.27%).
| Demographics | Rating | Rank | Master's Degree |
| West Indians | 27.4 /100 | #198 | Fair 14.5% |
| Immigrants | Armenia | 27.2 /100 | #199 | Fair 14.5% |
| Panamanians | 25.1 /100 | #200 | Fair 14.4% |
| Scotch-Irish | 25.0 /100 | #201 | Fair 14.4% |
| Immigrants | Western Africa | 24.9 /100 | #202 | Fair 14.4% |
| Yugoslavians | 24.3 /100 | #203 | Fair 14.4% |
| French | 23.7 /100 | #204 | Fair 14.4% |
| Trinidadians and Tobagonians | 23.5 /100 | #205 | Fair 14.4% |
| Scandinavians | 23.3 /100 | #206 | Fair 14.4% |
| Immigrants | Bosnia and Herzegovina | 22.0 /100 | #207 | Fair 14.3% |
| Immigrants | Barbados | 20.5 /100 | #208 | Fair 14.3% |
| Immigrants | Panama | 20.0 /100 | #209 | Fair 14.3% |
| Sub-Saharan Africans | 19.4 /100 | #210 | Poor 14.2% |
| Somalis | 18.0 /100 | #211 | Poor 14.2% |
| Spanish | 17.8 /100 | #212 | Poor 14.2% |
Demographics Similar to Immigrants from Ethiopia by Master's Degree
In terms of master's degree, the demographic groups most similar to Immigrants from Ethiopia are Immigrants from Argentina (18.0%, a difference of 0.23%), Ethiopian (18.0%, a difference of 0.27%), Immigrants from Kazakhstan (18.0%, a difference of 0.30%), Immigrants from Uzbekistan (17.9%, a difference of 0.33%), and Immigrants from Western Europe (17.8%, a difference of 0.54%).
| Demographics | Rating | Rank | Master's Degree |
| Immigrants | Europe | 99.9 /100 | #61 | Exceptional 18.2% |
| Argentineans | 99.9 /100 | #62 | Exceptional 18.2% |
| Immigrants | Netherlands | 99.9 /100 | #63 | Exceptional 18.1% |
| South Africans | 99.9 /100 | #64 | Exceptional 18.1% |
| Immigrants | Kazakhstan | 99.8 /100 | #65 | Exceptional 18.0% |
| Ethiopians | 99.8 /100 | #66 | Exceptional 18.0% |
| Immigrants | Argentina | 99.8 /100 | #67 | Exceptional 18.0% |
| Immigrants | Ethiopia | 99.8 /100 | #68 | Exceptional 17.9% |
| Immigrants | Uzbekistan | 99.8 /100 | #69 | Exceptional 17.9% |
| Immigrants | Western Europe | 99.8 /100 | #70 | Exceptional 17.8% |
| Immigrants | Pakistan | 99.7 /100 | #71 | Exceptional 17.8% |
| Lithuanians | 99.7 /100 | #72 | Exceptional 17.7% |
| Zimbabweans | 99.7 /100 | #73 | Exceptional 17.7% |
| Immigrants | Romania | 99.7 /100 | #74 | Exceptional 17.7% |
| Egyptians | 99.6 /100 | #75 | Exceptional 17.6% |