Thai vs Immigrants from Iraq 5th Grade

COMPARE

Thai
Race
Ancestry
AfghanAfricanAlaska NativeAlaskan AthabascanAlbanianAleutAlsatianAmericanApacheArabArapahoArgentineanArmenianAssyrian/Chaldean/SyriacAustralianAustrianBahamianBangladeshiBarbadianBasqueBelgianBelizeanBermudanBhutaneseBlackfeetBolivianBrazilianBritishBritish West IndianBulgarianBurmeseCajunCambodianCanadianCape VerdeanCarpatho RusynCelticCentral AmericanCentral American IndianCherokeeCheyenneChickasawChileanChineseChippewaChoctawColombianColvilleComancheCosta RicanCreeCreekCroatianCrowCubanCypriotCzechCzechoslovakianDanishDelawareDominicanDutchDutch West IndianEastern EuropeanEcuadorianEgyptianEnglishEstonianEthiopianEuropeanFijianFilipinoFinnishFrenchFrench American IndianFrench CanadianGermanGerman RussianGhanaianGreekGuamanian/ChamorroGuatemalanGuyaneseHaitianHmongHonduranHopiHoumaHungarianIcelanderIndian (Asian)IndonesianInupiatIranianIraqiIrishIroquoisIsraeliItalianJamaicanJapaneseJordanianKenyanKiowaKoreanLaotianLatvianLebaneseLiberianLithuanianLumbeeLuxembourgerMacedonianMalaysianMalteseMarshalleseMenomineeMexicanMexican American IndianMongolianMoroccanNative HawaiianNavajoNepaleseNew ZealanderNicaraguanNigerianNorthern EuropeanNorwegianOkinawanOsageOttawaPaiutePakistaniPalestinianPanamanianParaguayanPennsylvania GermanPeruvianPimaPolishPortuguesePotawatomiPuebloPuerto RicanPuget Sound SalishRomanianRussianSalvadoranSamoanScandinavianScotch-IrishScottishSeminoleSenegaleseSerbianShoshoneSierra LeoneanSiouxSlavicSlovakSloveneSomaliSouth AfricanSouth AmericanSouth American IndianSoviet UnionSpaniardSpanishSpanish AmericanSpanish American IndianSri LankanSubsaharan AfricanSudaneseSwedishSwissSyrianTaiwaneseThaiTlingit-HaidaTohono O'OdhamTonganTrinidadian and TobagonianTsimshianTurkishU.S. Virgin IslanderUgandanUkrainianUruguayanUteVenezuelanVietnameseWelshWest IndianYakamaYaquiYugoslavianYumanYup'ikZimbabwean
Immigration
NonimmigrantsImmigrantsAfghanistanAfricaAlbaniaArgentinaArmeniaAsiaAustraliaAustriaBahamasBangladeshBarbadosBelarusBelgiumBelizeBoliviaBosnia and HerzegovinaBrazilBulgariaBurma/MyanmarCabo VerdeCambodiaCameroonCanadaCaribbeanCentral AmericaChileChinaColombiaCongoCosta RicaCroatiaCubaCzechoslovakiaDenmarkDominicaDominican RepublicEastern AfricaEastern AsiaEastern EuropeEcuadorEgyptEl SalvadorEnglandEritreaEthiopiaEuropeFijiFranceGermanyGhanaGreeceGrenadaGuatemalaGuyanaHaitiHondurasHong KongHungaryIndiaIndonesiaIranIrelandIsraelItalyJamaicaJapanJordanKazakhstanKenyaKoreaKuwaitLaosLatin AmericaLatviaLebanonLiberiaLithuaniaMalaysiaMexicoMicronesiaMiddle AfricaMoldovaMoroccoNepalNetherlandsNicaraguaNigeriaNorth AmericaNorth MacedoniaNorthern AfricaNorthern EuropeNorwayOceaniaPakistanPanamaPeruPhilippinesPolandPortugalRomaniaRussiaSaudi ArabiaScotlandSenegalSerbiaSierra LeoneSingaporeSomaliaSouth AfricaSouth AmericaSouth Central AsiaSouth Eastern AsiaSouthern EuropeSpainSri LankaSt. Vincent and the GrenadinesSudanSwedenSwitzerlandSyriaTaiwanThailandTrinidad and TobagoTurkeyUgandaUkraineUruguayUzbekistanVenezuelaVietnamWest IndiesWestern AfricaWestern AsiaWestern EuropeYemenZaireZimbabweAzores
Immigrants from Iraq
Race
Ancestry
AfghanAfricanAlaska NativeAlaskan AthabascanAlbanianAleutAlsatianAmericanApacheArabArapahoArgentineanArmenianAssyrian/Chaldean/SyriacAustralianAustrianBahamianBangladeshiBarbadianBasqueBelgianBelizeanBermudanBhutaneseBlackfeetBolivianBrazilianBritishBritish West IndianBulgarianBurmeseCajunCambodianCanadianCape VerdeanCarpatho RusynCelticCentral AmericanCentral American IndianCherokeeCheyenneChickasawChileanChineseChippewaChoctawColombianColvilleComancheCosta RicanCreeCreekCroatianCrowCubanCypriotCzechCzechoslovakianDanishDelawareDominicanDutchDutch West IndianEastern EuropeanEcuadorianEgyptianEnglishEstonianEthiopianEuropeanFijianFilipinoFinnishFrenchFrench American IndianFrench CanadianGermanGerman RussianGhanaianGreekGuamanian/ChamorroGuatemalanGuyaneseHaitianHmongHonduranHopiHoumaHungarianIcelanderIndian (Asian)IndonesianInupiatIranianIraqiIrishIroquoisIsraeliItalianJamaicanJapaneseJordanianKenyanKiowaKoreanLaotianLatvianLebaneseLiberianLithuanianLumbeeLuxembourgerMacedonianMalaysianMalteseMarshalleseMenomineeMexicanMexican American IndianMongolianMoroccanNative HawaiianNavajoNepaleseNew ZealanderNicaraguanNigerianNorthern EuropeanNorwegianOkinawanOsageOttawaPaiutePakistaniPalestinianPanamanianParaguayanPennsylvania GermanPeruvianPimaPolishPortuguesePotawatomiPuebloPuerto RicanPuget Sound SalishRomanianRussianSalvadoranSamoanScandinavianScotch-IrishScottishSeminoleSenegaleseSerbianShoshoneSierra LeoneanSiouxSlavicSlovakSloveneSomaliSouth AfricanSouth AmericanSouth American IndianSoviet UnionSpaniardSpanishSpanish AmericanSpanish American IndianSri LankanSubsaharan AfricanSudaneseSwedishSwissSyrianTaiwaneseTlingit-HaidaTohono O'OdhamTonganTrinidadian and TobagonianTsimshianTurkishU.S. Virgin IslanderUgandanUkrainianUruguayanUteVenezuelanVietnameseWelshWest IndianYakamaYaquiYugoslavianYumanYup'ikZimbabwean
Immigration
NonimmigrantsImmigrantsAfghanistanAfricaAlbaniaArgentinaArmeniaAsiaAustraliaAustriaBahamasBangladeshBarbadosBelarusBelgiumBelizeBoliviaBosnia and HerzegovinaBrazilBulgariaBurma/MyanmarCabo VerdeCambodiaCameroonCanadaCaribbeanCentral AmericaChileChinaColombiaCongoCosta RicaCroatiaCubaCzechoslovakiaDenmarkDominicaDominican RepublicEastern AfricaEastern AsiaEastern EuropeEcuadorEgyptEl SalvadorEnglandEritreaEthiopiaEuropeFijiFranceGermanyGhanaGreeceGrenadaGuatemalaGuyanaHaitiHondurasHong KongHungaryIndiaIndonesiaIranIraqIrelandIsraelItalyJamaicaJapanJordanKazakhstanKenyaKoreaKuwaitLaosLatin AmericaLatviaLebanonLiberiaLithuaniaMalaysiaMexicoMicronesiaMiddle AfricaMoldovaMoroccoNepalNetherlandsNicaraguaNigeriaNorth AmericaNorth MacedoniaNorthern AfricaNorthern EuropeNorwayOceaniaPakistanPanamaPeruPhilippinesPolandPortugalRomaniaRussiaSaudi ArabiaScotlandSenegalSerbiaSierra LeoneSingaporeSomaliaSouth AfricaSouth AmericaSouth Central AsiaSouth Eastern AsiaSouthern EuropeSpainSri LankaSt. Vincent and the GrenadinesSudanSwedenSwitzerlandSyriaTaiwanThailandTrinidad and TobagoTurkeyUgandaUkraineUruguayUzbekistanVenezuelaVietnamWest IndiesWestern AfricaWestern AsiaWestern EuropeYemenZaireZimbabweAzores
5th Grade
Income
Poverty
Unemployment
Labor Participation
Family Structure
Vehicle Availability
Education Level
Disability

5th Grade Comparison

Thais

Immigrants from Iraq

Exceptional
Tragic
97.7%
5TH GRADE
96.9/ 100
METRIC RATING
110th/ 347
METRIC RANK
97.1%
5TH GRADE
8.3/ 100
METRIC RATING
212th/ 347
METRIC RANK

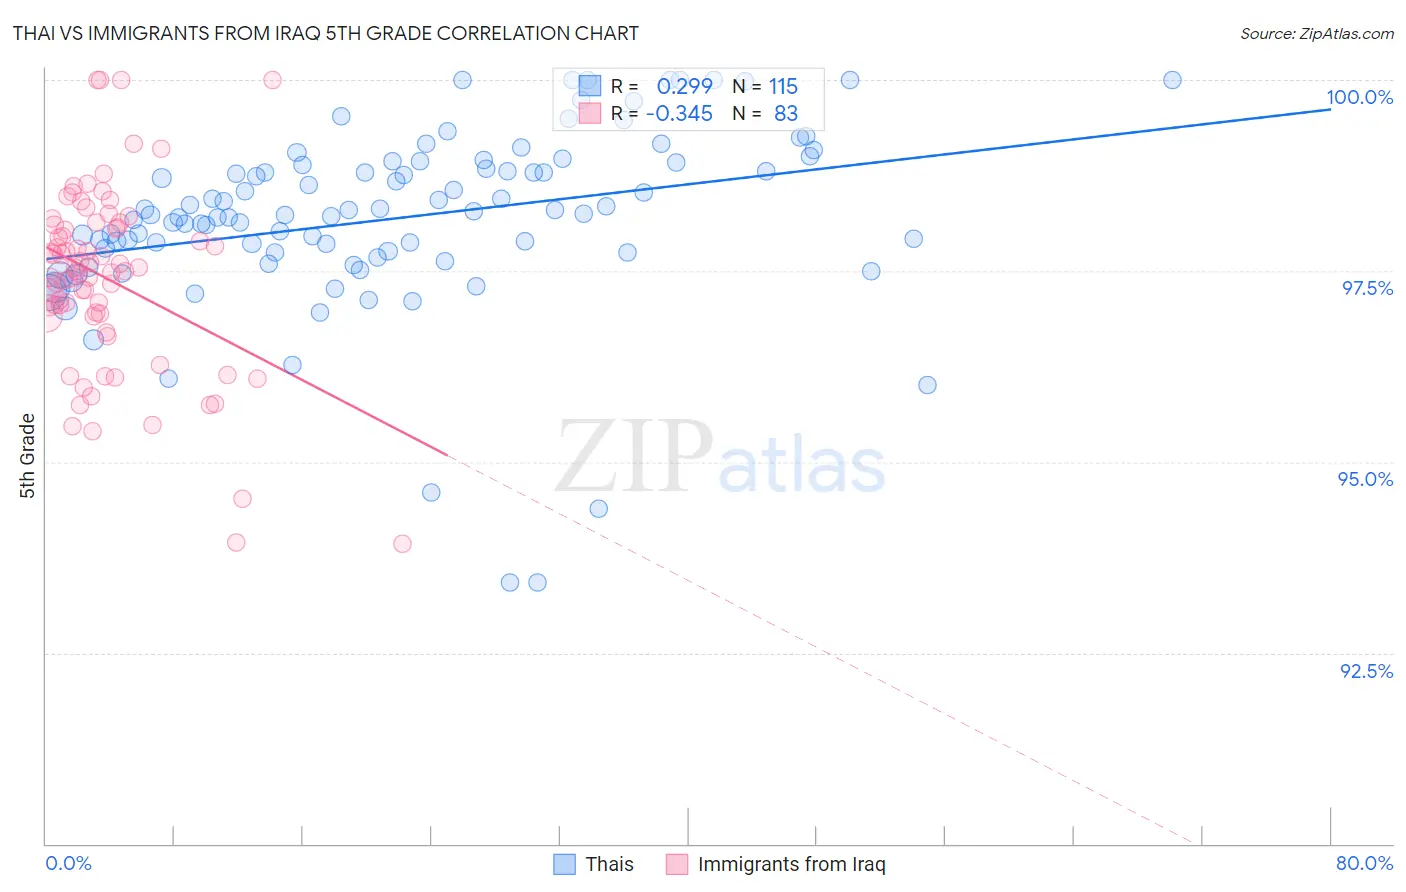
Thai vs Immigrants from Iraq 5th Grade Correlation Chart

The statistical analysis conducted on geographies consisting of 475,866,115 people shows a weak positive correlation between the proportion of Thais and percentage of population with at least 5th grade education in the United States with a correlation coefficient (R) of 0.299 and weighted average of 97.7%. Similarly, the statistical analysis conducted on geographies consisting of 194,632,332 people shows a mild negative correlation between the proportion of Immigrants from Iraq and percentage of population with at least 5th grade education in the United States with a correlation coefficient (R) of -0.345 and weighted average of 97.1%, a difference of 0.61%.
Thai vs Immigrants from Iraq 5th Grade

5th Grade Correlation Summary

MeasurementThaiImmigrants from Iraq
Minimum93.4%93.9%
Maximum100.0%100.0%
Range6.6%6.1%
Mean98.2%97.4%
Median98.2%97.5%
Interquartile 25% (IQ1)97.7%96.9%
Interquartile 75% (IQ3)98.9%98.1%
Interquartile Range (IQR)1.2%1.2%
Standard Deviation (Sample)1.2%1.2%
Standard Deviation (Population)1.2%1.2%

Similar Demographics by 5th Grade

Demographics Similar to Thais by 5th Grade

In terms of 5th grade, the demographic groups most similar to Thais are Nonimmigrants (97.7%, a difference of 0.010%), Immigrants from Latvia (97.7%, a difference of 0.010%), Immigrants from Czechoslovakia (97.7%, a difference of 0.020%), Immigrants from Singapore (97.7%, a difference of 0.020%), and Menominee (97.7%, a difference of 0.020%).
DemographicsRating | Rank5th Grade
Cheyenne
97.9
/100
|
#103
Exceptional
97.7%
German Russians
97.8
/100
|
#104
Exceptional
97.7%
Bhutanese
97.6
/100
|
#105
Exceptional
97.7%
Immigrants | Czechoslovakia
97.5
/100
|
#106
Exceptional
97.7%
Immigrants | Singapore
97.5
/100
|
#107
Exceptional
97.7%
Immigrants | Nonimmigrants
97.3
/100
|
#108
Exceptional
97.7%
Immigrants | Latvia
97.1
/100
|
#109
Exceptional
97.7%
Thais
96.9
/100
|
#110
Exceptional
97.7%
Menominee
96.3
/100
|
#111
Exceptional
97.7%
Immigrants | Switzerland
96.0
/100
|
#112
Exceptional
97.7%
Iroquois
95.9
/100
|
#113
Exceptional
97.7%
Lebanese
95.7
/100
|
#114
Exceptional
97.6%
Okinawans
95.7
/100
|
#115
Exceptional
97.6%
Immigrants | Croatia
95.5
/100
|
#116
Exceptional
97.6%
Immigrants | Saudi Arabia
95.4
/100
|
#117
Exceptional
97.6%

Demographics Similar to Immigrants from Iraq by 5th Grade

In terms of 5th grade, the demographic groups most similar to Immigrants from Iraq are Samoan (97.1%, a difference of 0.0%), Portuguese (97.1%, a difference of 0.010%), Costa Rican (97.1%, a difference of 0.010%), Immigrants from Morocco (97.1%, a difference of 0.010%), and Immigrants from Nepal (97.1%, a difference of 0.020%).
DemographicsRating | Rank5th Grade
Moroccans
12.0
/100
|
#205
Poor
97.1%
Paiute
11.6
/100
|
#206
Poor
97.1%
Iraqis
10.9
/100
|
#207
Poor
97.1%
Laotians
10.8
/100
|
#208
Poor
97.1%
Immigrants | Nepal
10.3
/100
|
#209
Poor
97.1%
Immigrants | Oceania
10.0
/100
|
#210
Poor
97.1%
Samoans
8.5
/100
|
#211
Tragic
97.1%
Immigrants | Iraq
8.3
/100
|
#212
Tragic
97.1%
Portuguese
7.8
/100
|
#213
Tragic
97.1%
Costa Ricans
7.7
/100
|
#214
Tragic
97.1%
Immigrants | Morocco
7.5
/100
|
#215
Tragic
97.1%
Sudanese
7.0
/100
|
#216
Tragic
97.1%
Immigrants | Lebanon
6.8
/100
|
#217
Tragic
97.1%
Immigrants | Sudan
6.5
/100
|
#218
Tragic
97.1%
Immigrants | Syria
6.4
/100
|
#219
Tragic
97.1%