Immigrants from Cambodia vs Immigrants from Ukraine Householder Income Ages 45 - 64 years
COMPARE
Immigrants from Cambodia
Immigrants from Ukraine
Householder Income Ages 45 - 64 years
Householder Income Ages 45 - 64 years Comparison
Immigrants from Cambodia
Immigrants from Ukraine
$96,537
HOUSEHOLDER INCOME AGES 45 - 64 YEARS
13.0/ 100
METRIC RATING
211th/ 347
METRIC RANK
$107,079
HOUSEHOLDER INCOME AGES 45 - 64 YEARS
96.7/ 100
METRIC RATING
104th/ 347
METRIC RANK
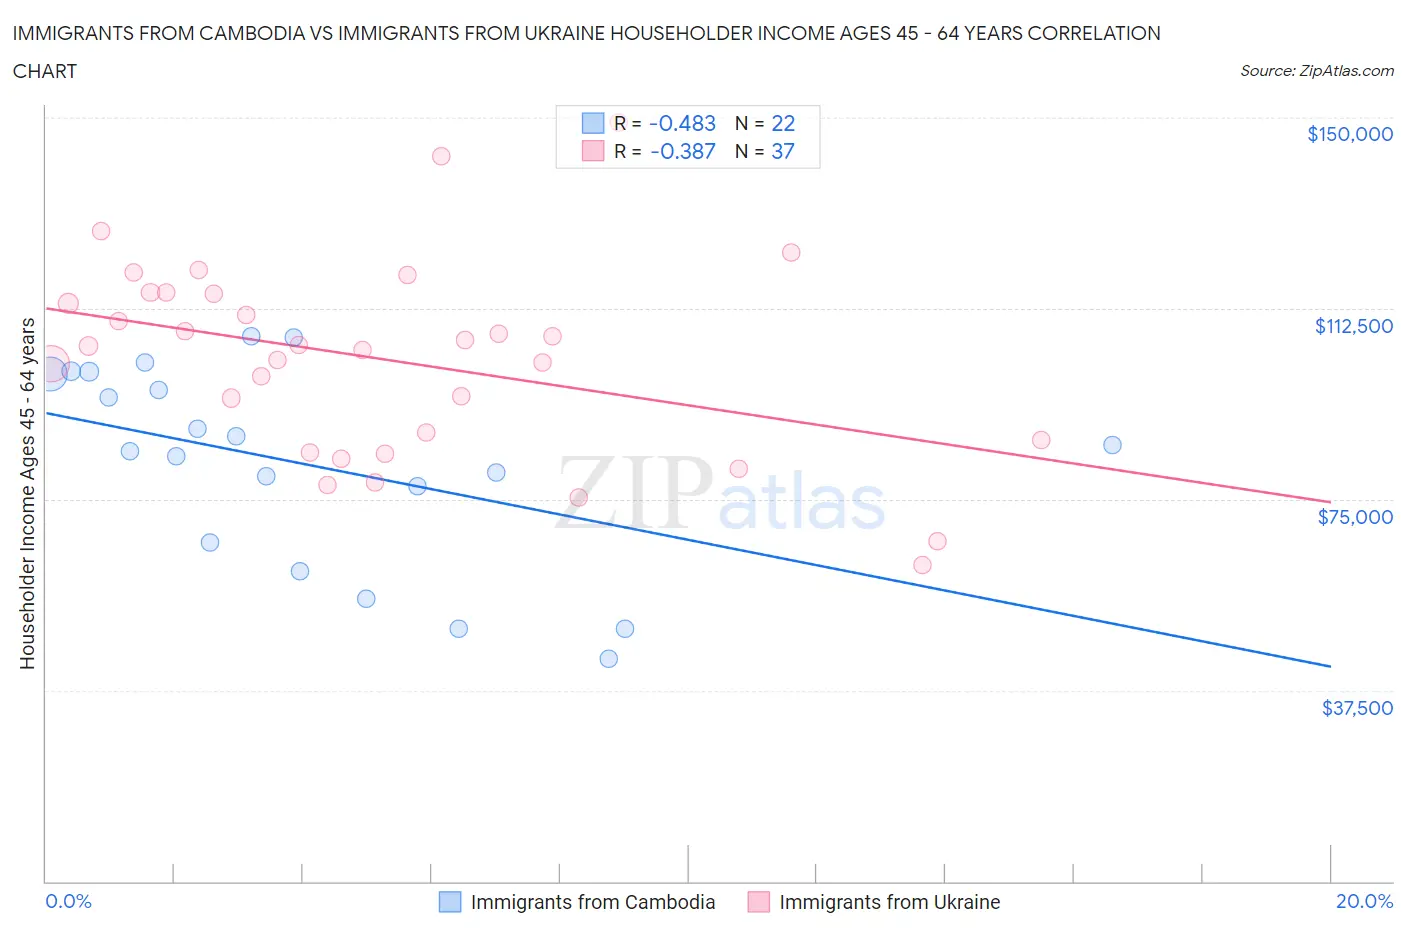
Immigrants from Cambodia vs Immigrants from Ukraine Householder Income Ages 45 - 64 years Correlation Chart
The statistical analysis conducted on geographies consisting of 205,043,738 people shows a moderate negative correlation between the proportion of Immigrants from Cambodia and household income with householder between the ages 45 and 64 in the United States with a correlation coefficient (R) of -0.483 and weighted average of $96,537. Similarly, the statistical analysis conducted on geographies consisting of 289,443,409 people shows a mild negative correlation between the proportion of Immigrants from Ukraine and household income with householder between the ages 45 and 64 in the United States with a correlation coefficient (R) of -0.387 and weighted average of $107,079, a difference of 10.9%.
Householder Income Ages 45 - 64 years Correlation Summary
| Measurement | Immigrants from Cambodia | Immigrants from Ukraine |
| Minimum | $43,614 | $62,178 |
| Maximum | $107,055 | $148,942 |
| Range | $63,441 | $86,764 |
| Mean | $81,812 | $102,397 |
| Median | $85,046 | $105,174 |
| Interquartile 25% (IQ1) | $66,651 | $85,429 |
| Interquartile 75% (IQ3) | $99,554 | $115,436 |
| Interquartile Range (IQR) | $32,903 | $30,007 |
| Standard Deviation (Sample) | $19,590 | $19,369 |
| Standard Deviation (Population) | $19,140 | $19,105 |
Similar Demographics by Householder Income Ages 45 - 64 years
Demographics Similar to Immigrants from Cambodia by Householder Income Ages 45 - 64 years
In terms of householder income ages 45 - 64 years, the demographic groups most similar to Immigrants from Cambodia are Venezuelan ($96,460, a difference of 0.080%), Tsimshian ($96,783, a difference of 0.26%), Japanese ($96,834, a difference of 0.31%), Immigrants from Uruguay ($96,086, a difference of 0.47%), and Panamanian ($96,066, a difference of 0.49%).
| Demographics | Rating | Rank | Householder Income Ages 45 - 64 years |
| Immigrants | Eritrea | 18.6 /100 | #204 | Poor $97,373 |
| Immigrants | Colombia | 18.0 /100 | #205 | Poor $97,290 |
| Immigrants | Africa | 17.9 /100 | #206 | Poor $97,284 |
| Ghanaians | 17.9 /100 | #207 | Poor $97,277 |
| Scotch-Irish | 16.4 /100 | #208 | Poor $97,073 |
| Japanese | 14.8 /100 | #209 | Poor $96,834 |
| Tsimshian | 14.5 /100 | #210 | Poor $96,783 |
| Immigrants | Cambodia | 13.0 /100 | #211 | Poor $96,537 |
| Venezuelans | 12.6 /100 | #212 | Poor $96,460 |
| Immigrants | Uruguay | 10.7 /100 | #213 | Poor $96,086 |
| Panamanians | 10.6 /100 | #214 | Poor $96,066 |
| Nigerians | 8.2 /100 | #215 | Tragic $95,492 |
| Immigrants | Venezuela | 7.6 /100 | #216 | Tragic $95,342 |
| Immigrants | Ghana | 6.4 /100 | #217 | Tragic $94,982 |
| Delaware | 6.2 /100 | #218 | Tragic $94,914 |
Demographics Similar to Immigrants from Ukraine by Householder Income Ages 45 - 64 years
In terms of householder income ages 45 - 64 years, the demographic groups most similar to Immigrants from Ukraine are Macedonian ($107,074, a difference of 0.0%), Armenian ($107,002, a difference of 0.070%), Syrian ($107,207, a difference of 0.12%), Immigrants from Fiji ($106,952, a difference of 0.12%), and Zimbabwean ($106,849, a difference of 0.22%).
| Demographics | Rating | Rank | Householder Income Ages 45 - 64 years |
| Northern Europeans | 97.8 /100 | #97 | Exceptional $107,870 |
| Immigrants | Southern Europe | 97.7 /100 | #98 | Exceptional $107,775 |
| Palestinians | 97.6 /100 | #99 | Exceptional $107,721 |
| Immigrants | Serbia | 97.4 /100 | #100 | Exceptional $107,569 |
| Immigrants | Kazakhstan | 97.2 /100 | #101 | Exceptional $107,378 |
| Immigrants | Moldova | 97.1 /100 | #102 | Exceptional $107,357 |
| Syrians | 96.9 /100 | #103 | Exceptional $107,207 |
| Immigrants | Ukraine | 96.7 /100 | #104 | Exceptional $107,079 |
| Macedonians | 96.7 /100 | #105 | Exceptional $107,074 |
| Armenians | 96.6 /100 | #106 | Exceptional $107,002 |
| Immigrants | Fiji | 96.5 /100 | #107 | Exceptional $106,952 |
| Zimbabweans | 96.3 /100 | #108 | Exceptional $106,849 |
| Chileans | 95.9 /100 | #109 | Exceptional $106,611 |
| Immigrants | Brazil | 95.6 /100 | #110 | Exceptional $106,470 |
| Immigrants | Vietnam | 95.5 /100 | #111 | Exceptional $106,417 |