Swiss vs Immigrants from Brazil 2nd Grade
COMPARE
Swiss
Immigrants from Brazil
2nd Grade
2nd Grade Comparison
Swiss
Immigrants from Brazil
98.5%
2ND GRADE
100.0/ 100
METRIC RATING
35th/ 347
METRIC RANK
97.9%
2ND GRADE
46.6/ 100
METRIC RATING
177th/ 347
METRIC RANK
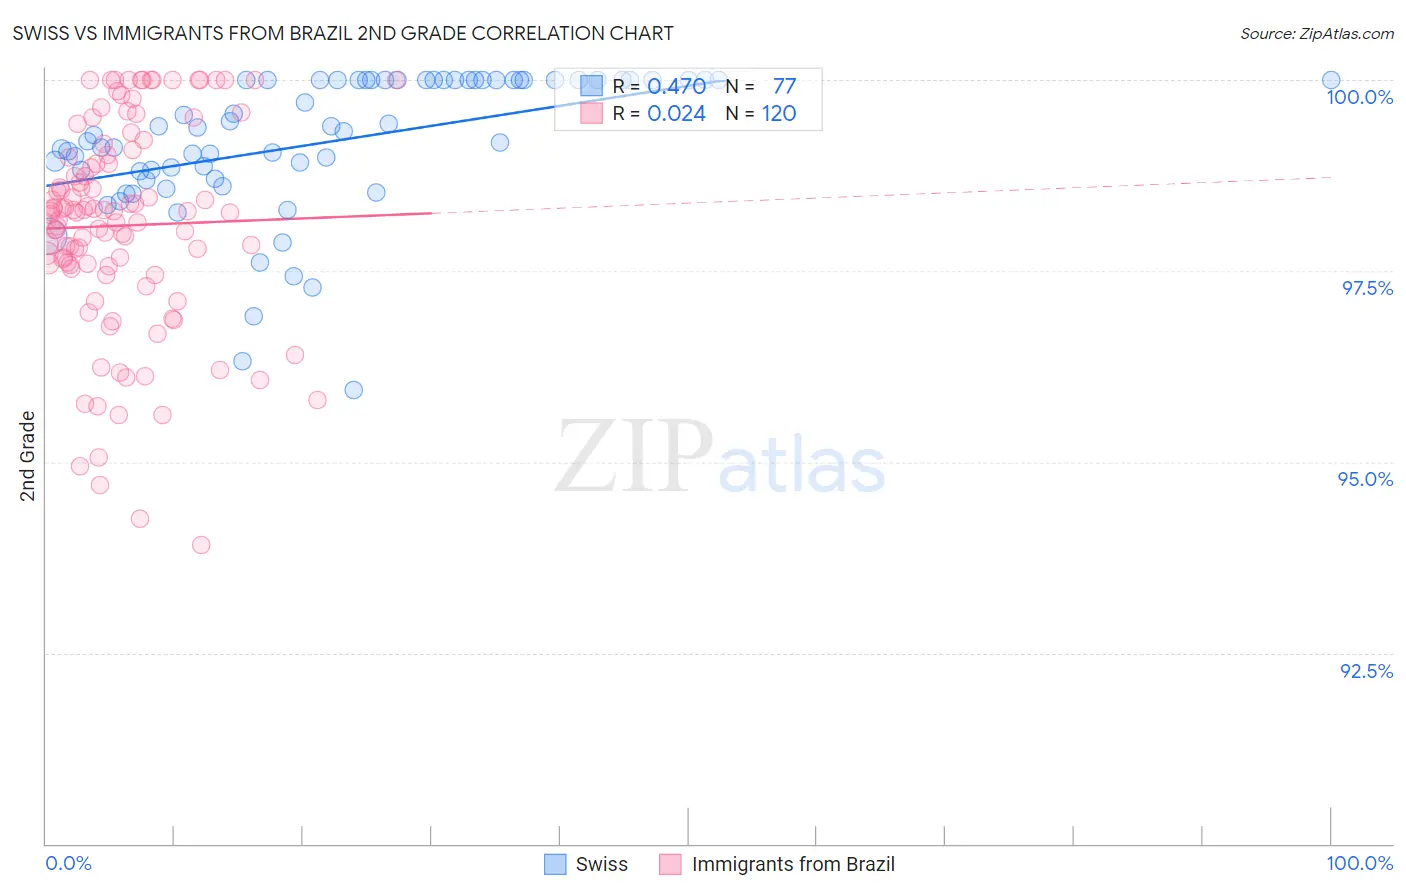
Swiss vs Immigrants from Brazil 2nd Grade Correlation Chart
The statistical analysis conducted on geographies consisting of 465,023,158 people shows a moderate positive correlation between the proportion of Swiss and percentage of population with at least 2nd grade education in the United States with a correlation coefficient (R) of 0.470 and weighted average of 98.5%. Similarly, the statistical analysis conducted on geographies consisting of 343,021,580 people shows no correlation between the proportion of Immigrants from Brazil and percentage of population with at least 2nd grade education in the United States with a correlation coefficient (R) of 0.024 and weighted average of 97.9%, a difference of 0.63%.
2nd Grade Correlation Summary
| Measurement | Swiss | Immigrants from Brazil |
| Minimum | 95.9% | 93.9% |
| Maximum | 100.0% | 100.0% |
| Range | 4.1% | 6.1% |
| Mean | 99.2% | 98.1% |
| Median | 99.3% | 98.3% |
| Interquartile 25% (IQ1) | 98.8% | 97.6% |
| Interquartile 75% (IQ3) | 100.0% | 99.0% |
| Interquartile Range (IQR) | 1.2% | 1.4% |
| Standard Deviation (Sample) | 0.91% | 1.4% |
| Standard Deviation (Population) | 0.91% | 1.4% |
Similar Demographics by 2nd Grade
Demographics Similar to Swiss by 2nd Grade
In terms of 2nd grade, the demographic groups most similar to Swiss are Chinese (98.5%, a difference of 0.010%), British (98.5%, a difference of 0.020%), European (98.5%, a difference of 0.030%), Czech (98.5%, a difference of 0.030%), and French Canadian (98.5%, a difference of 0.030%).
| Demographics | Rating | Rank | 2nd Grade |
| Arapaho | 100.0 /100 | #28 | Exceptional 98.5% |
| French | 100.0 /100 | #29 | Exceptional 98.5% |
| Europeans | 100.0 /100 | #30 | Exceptional 98.5% |
| Czechs | 100.0 /100 | #31 | Exceptional 98.5% |
| French Canadians | 100.0 /100 | #32 | Exceptional 98.5% |
| Scandinavians | 100.0 /100 | #33 | Exceptional 98.5% |
| Chinese | 100.0 /100 | #34 | Exceptional 98.5% |
| Swiss | 100.0 /100 | #35 | Exceptional 98.5% |
| British | 100.0 /100 | #36 | Exceptional 98.5% |
| Italians | 99.9 /100 | #37 | Exceptional 98.4% |
| Latvians | 99.9 /100 | #38 | Exceptional 98.4% |
| Chippewa | 99.9 /100 | #39 | Exceptional 98.4% |
| Luxembourgers | 99.9 /100 | #40 | Exceptional 98.4% |
| Eastern Europeans | 99.9 /100 | #41 | Exceptional 98.4% |
| Native Hawaiians | 99.9 /100 | #42 | Exceptional 98.4% |
Demographics Similar to Immigrants from Brazil by 2nd Grade
In terms of 2nd grade, the demographic groups most similar to Immigrants from Brazil are Argentinean (97.9%, a difference of 0.0%), Immigrants from Venezuela (97.9%, a difference of 0.0%), Immigrants from Micronesia (97.9%, a difference of 0.010%), Immigrants from Bosnia and Herzegovina (97.9%, a difference of 0.010%), and Immigrants from Sri Lanka (97.9%, a difference of 0.010%).
| Demographics | Rating | Rank | 2nd Grade |
| Navajo | 54.3 /100 | #170 | Average 97.9% |
| Albanians | 52.8 /100 | #171 | Average 97.9% |
| Immigrants | Korea | 52.7 /100 | #172 | Average 97.9% |
| Kenyans | 52.7 /100 | #173 | Average 97.9% |
| Immigrants | Micronesia | 50.0 /100 | #174 | Average 97.9% |
| Immigrants | Bosnia and Herzegovina | 49.8 /100 | #175 | Average 97.9% |
| Immigrants | Sri Lanka | 48.7 /100 | #176 | Average 97.9% |
| Immigrants | Brazil | 46.6 /100 | #177 | Average 97.9% |
| Argentineans | 46.3 /100 | #178 | Average 97.9% |
| Immigrants | Venezuela | 46.1 /100 | #179 | Average 97.9% |
| Natives/Alaskans | 44.3 /100 | #180 | Average 97.9% |
| Egyptians | 44.3 /100 | #181 | Average 97.9% |
| Portuguese | 42.4 /100 | #182 | Average 97.8% |
| Immigrants | Poland | 42.2 /100 | #183 | Average 97.8% |
| Immigrants | Belarus | 41.5 /100 | #184 | Average 97.8% |