Swedish vs Immigrants from St. Vincent and the Grenadines Per Capita Income
COMPARE
Swedish
Immigrants from St. Vincent and the Grenadines
Per Capita Income
Per Capita Income Comparison
Swedes
Immigrants from St. Vincent and the Grenadines
$45,750
PER CAPITA INCOME
91.3/ 100
METRIC RATING
128th/ 347
METRIC RANK
$41,270
PER CAPITA INCOME
6.4/ 100
METRIC RATING
224th/ 347
METRIC RANK
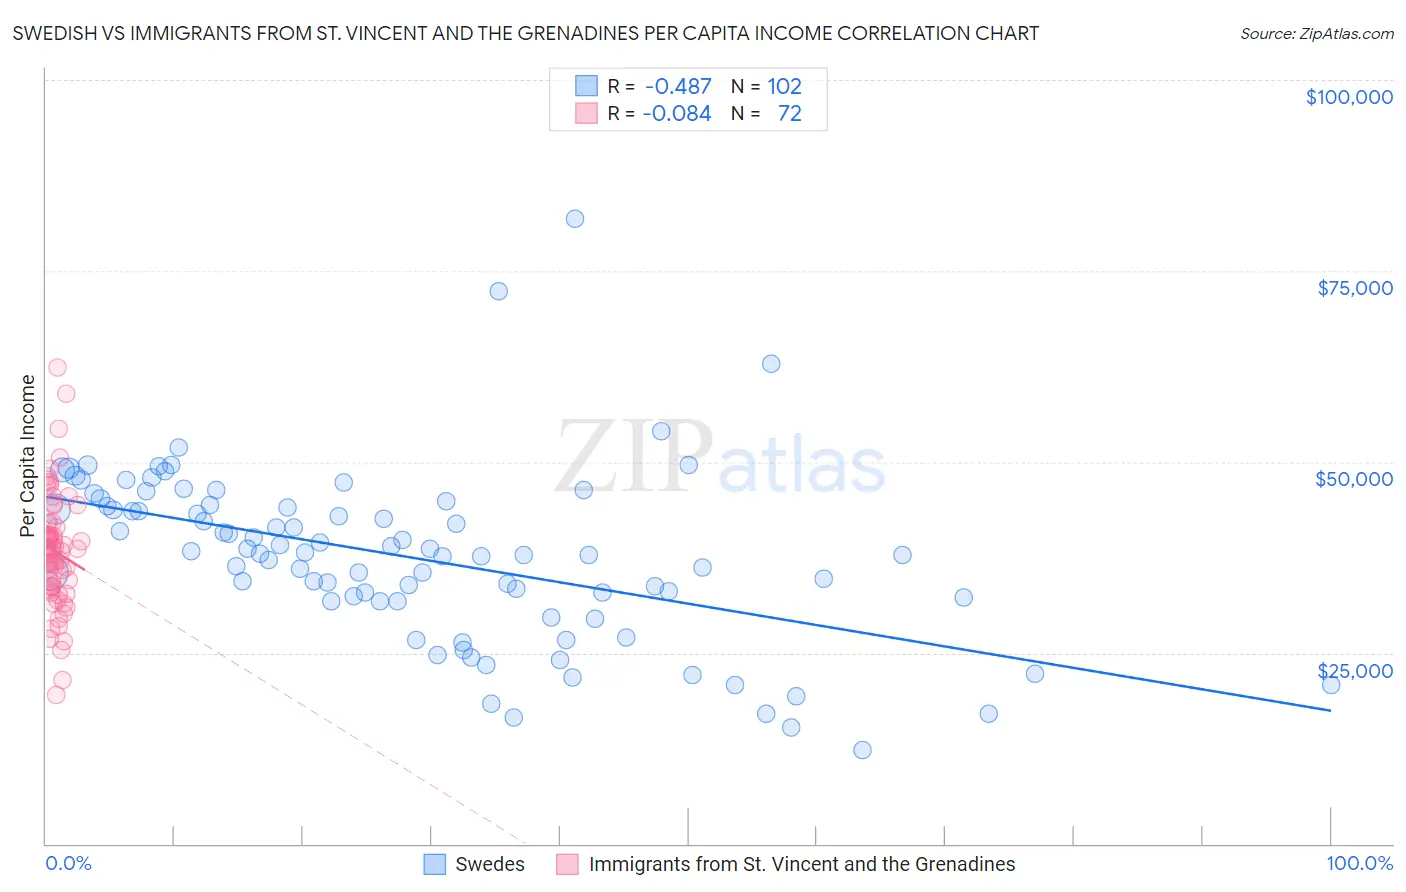
Swedish vs Immigrants from St. Vincent and the Grenadines Per Capita Income Correlation Chart
The statistical analysis conducted on geographies consisting of 539,281,463 people shows a moderate negative correlation between the proportion of Swedes and per capita income in the United States with a correlation coefficient (R) of -0.487 and weighted average of $45,750. Similarly, the statistical analysis conducted on geographies consisting of 56,193,038 people shows a slight negative correlation between the proportion of Immigrants from St. Vincent and the Grenadines and per capita income in the United States with a correlation coefficient (R) of -0.084 and weighted average of $41,270, a difference of 10.9%.
Per Capita Income Correlation Summary
| Measurement | Swedish | Immigrants from St. Vincent and the Grenadines |
| Minimum | $12,332 | $19,537 |
| Maximum | $81,765 | $62,321 |
| Range | $69,433 | $42,784 |
| Mean | $37,501 | $38,234 |
| Median | $37,895 | $38,416 |
| Interquartile 25% (IQ1) | $31,815 | $33,608 |
| Interquartile 75% (IQ3) | $44,149 | $41,632 |
| Interquartile Range (IQR) | $12,334 | $8,024 |
| Standard Deviation (Sample) | $11,325 | $7,601 |
| Standard Deviation (Population) | $11,269 | $7,548 |
Similar Demographics by Per Capita Income
Demographics Similar to Swedes by Per Capita Income
In terms of per capita income, the demographic groups most similar to Swedes are Immigrants from Germany ($45,751, a difference of 0.0%), Palestinian ($45,790, a difference of 0.090%), Zimbabwean ($45,804, a difference of 0.12%), European ($45,836, a difference of 0.19%), and Luxembourger ($45,663, a difference of 0.19%).
| Demographics | Rating | Rank | Per Capita Income |
| Canadians | 92.2 /100 | #121 | Exceptional $45,858 |
| Moroccans | 92.1 /100 | #122 | Exceptional $45,854 |
| Lebanese | 92.0 /100 | #123 | Exceptional $45,840 |
| Europeans | 92.0 /100 | #124 | Exceptional $45,836 |
| Zimbabweans | 91.7 /100 | #125 | Exceptional $45,804 |
| Palestinians | 91.6 /100 | #126 | Exceptional $45,790 |
| Immigrants | Germany | 91.3 /100 | #127 | Exceptional $45,751 |
| Swedes | 91.3 /100 | #128 | Exceptional $45,750 |
| Luxembourgers | 90.4 /100 | #129 | Exceptional $45,663 |
| Arabs | 90.4 /100 | #130 | Exceptional $45,662 |
| Immigrants | North Macedonia | 90.0 /100 | #131 | Exceptional $45,622 |
| Jordanians | 89.9 /100 | #132 | Excellent $45,605 |
| Pakistanis | 89.7 /100 | #133 | Excellent $45,587 |
| Slovenes | 89.6 /100 | #134 | Excellent $45,581 |
| Hungarians | 87.9 /100 | #135 | Excellent $45,426 |
Demographics Similar to Immigrants from St. Vincent and the Grenadines by Per Capita Income
In terms of per capita income, the demographic groups most similar to Immigrants from St. Vincent and the Grenadines are West Indian ($41,217, a difference of 0.13%), Immigrants from Cameroon ($41,334, a difference of 0.16%), Immigrants from Ecuador ($41,195, a difference of 0.18%), Immigrants from Iraq ($41,365, a difference of 0.23%), and Immigrants from Ghana ($41,131, a difference of 0.34%).
| Demographics | Rating | Rank | Per Capita Income |
| Guamanians/Chamorros | 9.7 /100 | #217 | Tragic $41,678 |
| Trinidadians and Tobagonians | 9.5 /100 | #218 | Tragic $41,655 |
| Puget Sound Salish | 8.1 /100 | #219 | Tragic $41,495 |
| Immigrants | Barbados | 7.9 /100 | #220 | Tragic $41,478 |
| Immigrants | Trinidad and Tobago | 7.9 /100 | #221 | Tragic $41,476 |
| Immigrants | Iraq | 7.1 /100 | #222 | Tragic $41,365 |
| Immigrants | Cameroon | 6.8 /100 | #223 | Tragic $41,334 |
| Immigrants | St. Vincent and the Grenadines | 6.4 /100 | #224 | Tragic $41,270 |
| West Indians | 6.0 /100 | #225 | Tragic $41,217 |
| Immigrants | Ecuador | 5.9 /100 | #226 | Tragic $41,195 |
| Immigrants | Ghana | 5.5 /100 | #227 | Tragic $41,131 |
| Immigrants | Grenada | 5.5 /100 | #228 | Tragic $41,123 |
| Nigerians | 4.9 /100 | #229 | Tragic $41,026 |
| Native Hawaiians | 4.9 /100 | #230 | Tragic $41,017 |
| Senegalese | 4.8 /100 | #231 | Tragic $41,000 |