Immigrants from Zaire vs Zimbabwean Per Capita Income
COMPARE
Immigrants from Zaire
Zimbabwean
Per Capita Income
Per Capita Income Comparison
Immigrants from Zaire
Zimbabweans
$38,848
PER CAPITA INCOME
0.4/ 100
METRIC RATING
267th/ 347
METRIC RANK
$45,804
PER CAPITA INCOME
91.7/ 100
METRIC RATING
125th/ 347
METRIC RANK
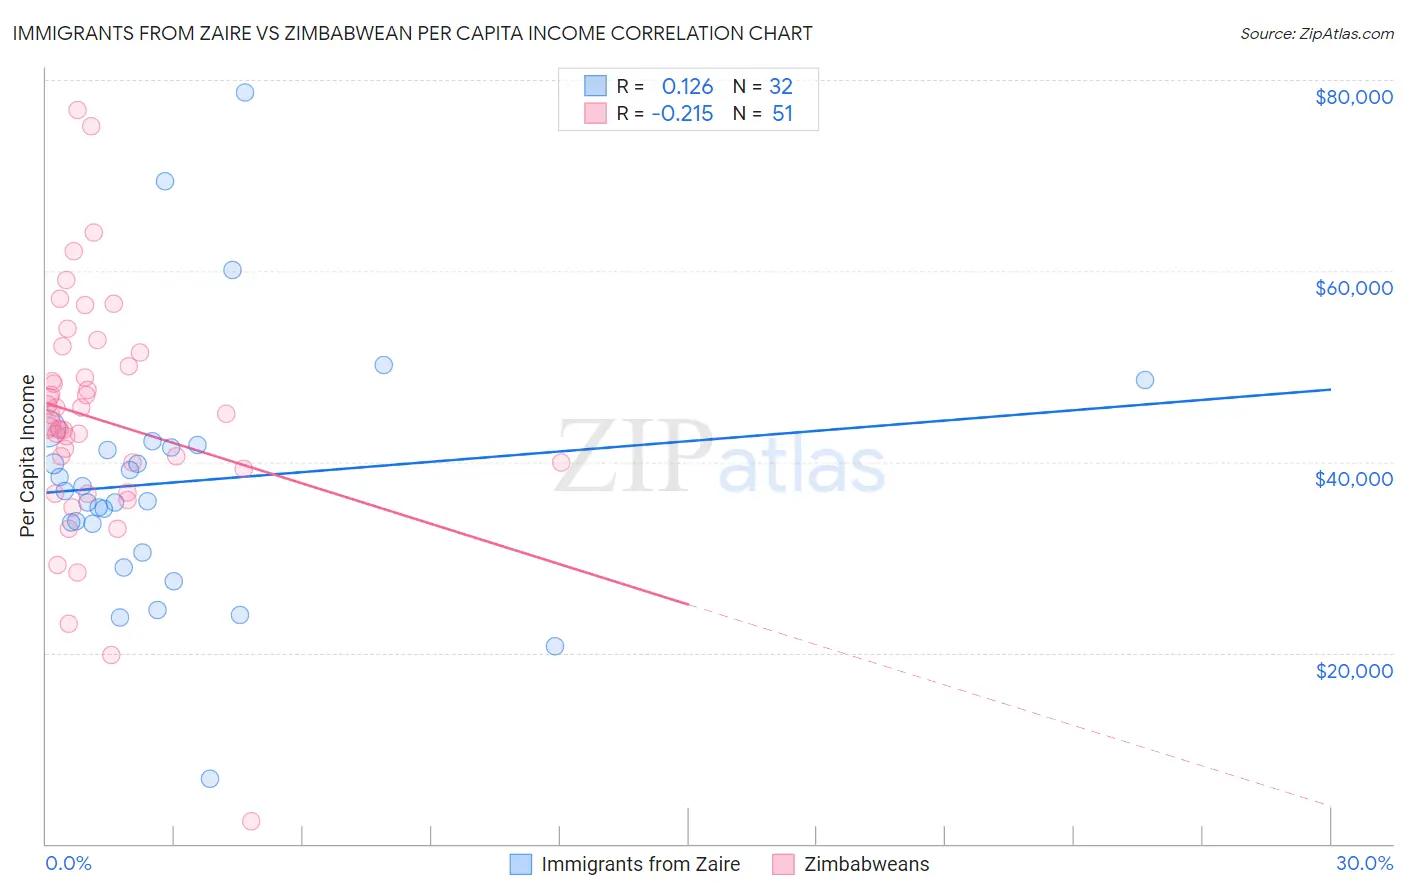
Immigrants from Zaire vs Zimbabwean Per Capita Income Correlation Chart
The statistical analysis conducted on geographies consisting of 107,255,805 people shows a poor positive correlation between the proportion of Immigrants from Zaire and per capita income in the United States with a correlation coefficient (R) of 0.126 and weighted average of $38,848. Similarly, the statistical analysis conducted on geographies consisting of 69,200,621 people shows a weak negative correlation between the proportion of Zimbabweans and per capita income in the United States with a correlation coefficient (R) of -0.215 and weighted average of $45,804, a difference of 17.9%.
Per Capita Income Correlation Summary
| Measurement | Immigrants from Zaire | Zimbabwean |
| Minimum | $6,803 | $2,302 |
| Maximum | $78,629 | $76,842 |
| Range | $71,826 | $74,540 |
| Mean | $37,941 | $44,445 |
| Median | $36,388 | $44,038 |
| Interquartile 25% (IQ1) | $32,029 | $39,330 |
| Interquartile 75% (IQ3) | $41,659 | $50,052 |
| Interquartile Range (IQR) | $9,630 | $10,722 |
| Standard Deviation (Sample) | $13,517 | $12,469 |
| Standard Deviation (Population) | $13,304 | $12,346 |
Similar Demographics by Per Capita Income
Demographics Similar to Immigrants from Zaire by Per Capita Income
In terms of per capita income, the demographic groups most similar to Immigrants from Zaire are Salvadoran ($38,858, a difference of 0.030%), Liberian ($38,780, a difference of 0.17%), Immigrants from Jamaica ($38,766, a difference of 0.21%), Spanish American ($39,012, a difference of 0.42%), and American ($39,039, a difference of 0.49%).
| Demographics | Rating | Rank | Per Capita Income |
| Alaskan Athabascans | 0.6 /100 | #260 | Tragic $39,163 |
| Marshallese | 0.6 /100 | #261 | Tragic $39,108 |
| Iroquois | 0.6 /100 | #262 | Tragic $39,104 |
| Belizeans | 0.6 /100 | #263 | Tragic $39,097 |
| Americans | 0.6 /100 | #264 | Tragic $39,039 |
| Spanish Americans | 0.5 /100 | #265 | Tragic $39,012 |
| Salvadorans | 0.5 /100 | #266 | Tragic $38,858 |
| Immigrants | Zaire | 0.4 /100 | #267 | Tragic $38,848 |
| Liberians | 0.4 /100 | #268 | Tragic $38,780 |
| Immigrants | Jamaica | 0.4 /100 | #269 | Tragic $38,766 |
| Immigrants | Belize | 0.3 /100 | #270 | Tragic $38,614 |
| Central Americans | 0.3 /100 | #271 | Tragic $38,560 |
| Immigrants | Cabo Verde | 0.3 /100 | #272 | Tragic $38,540 |
| Nepalese | 0.3 /100 | #273 | Tragic $38,442 |
| Immigrants | El Salvador | 0.3 /100 | #274 | Tragic $38,394 |
Demographics Similar to Zimbabweans by Per Capita Income
In terms of per capita income, the demographic groups most similar to Zimbabweans are Palestinian ($45,790, a difference of 0.030%), European ($45,836, a difference of 0.070%), Lebanese ($45,840, a difference of 0.080%), Moroccan ($45,854, a difference of 0.11%), and Canadian ($45,858, a difference of 0.12%).
| Demographics | Rating | Rank | Per Capita Income |
| Immigrants | Saudi Arabia | 93.3 /100 | #118 | Exceptional $46,008 |
| Immigrants | Poland | 93.1 /100 | #119 | Exceptional $45,979 |
| Immigrants | Ethiopia | 92.7 /100 | #120 | Exceptional $45,923 |
| Canadians | 92.2 /100 | #121 | Exceptional $45,858 |
| Moroccans | 92.1 /100 | #122 | Exceptional $45,854 |
| Lebanese | 92.0 /100 | #123 | Exceptional $45,840 |
| Europeans | 92.0 /100 | #124 | Exceptional $45,836 |
| Zimbabweans | 91.7 /100 | #125 | Exceptional $45,804 |
| Palestinians | 91.6 /100 | #126 | Exceptional $45,790 |
| Immigrants | Germany | 91.3 /100 | #127 | Exceptional $45,751 |
| Swedes | 91.3 /100 | #128 | Exceptional $45,750 |
| Luxembourgers | 90.4 /100 | #129 | Exceptional $45,663 |
| Arabs | 90.4 /100 | #130 | Exceptional $45,662 |
| Immigrants | North Macedonia | 90.0 /100 | #131 | Exceptional $45,622 |
| Jordanians | 89.9 /100 | #132 | Excellent $45,605 |